

Prices
September 22, 2013
Transportation Update September 2013
Written by Peter Wright
Ocean Freight
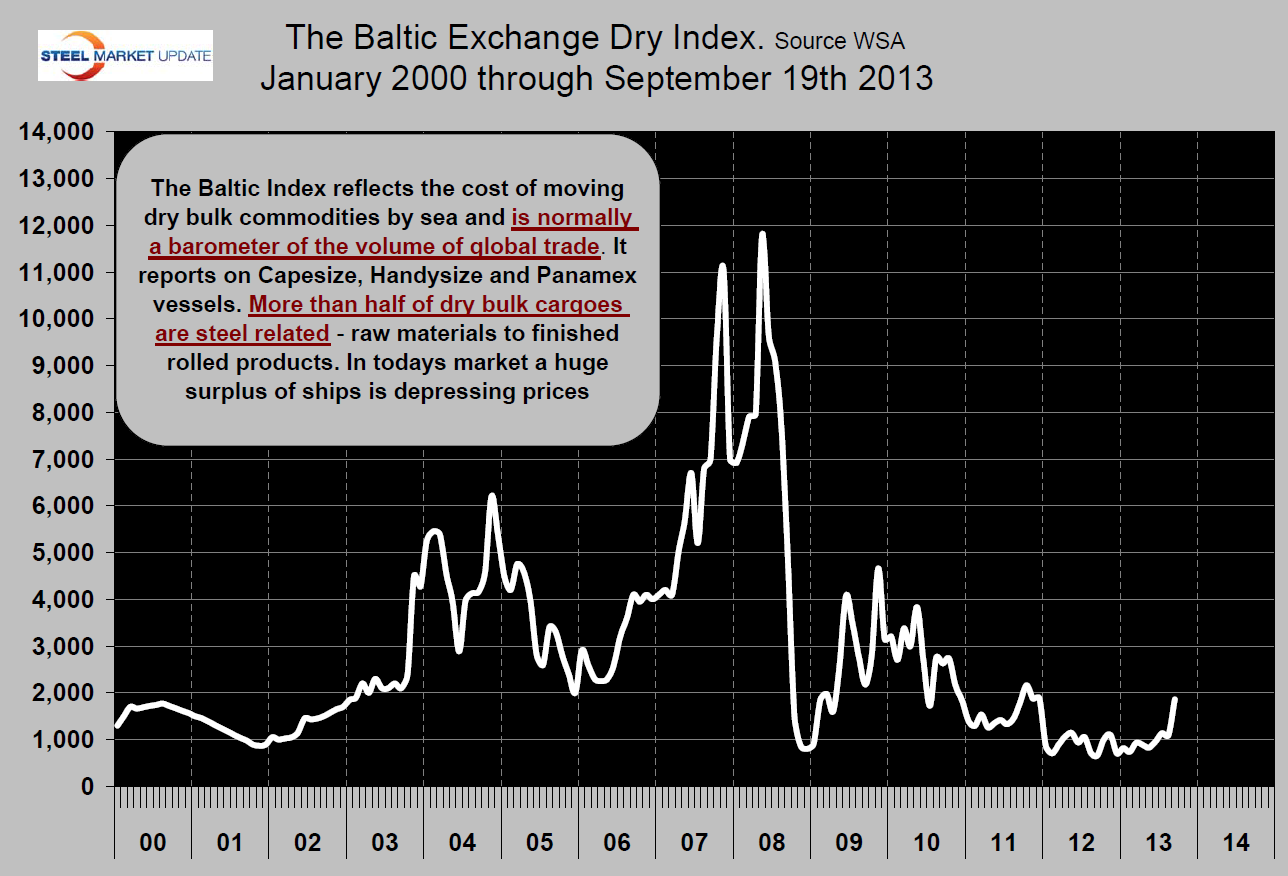
Ocean freight rates, as reported by the Baltic Exchange, have rebounded strongly in the last few months driven mainly by the cape-size component. The composite Baltic Dry Index has risen by 152 percent from its 2013 low point in February an increase from 737 to 1860 (Figure 1). The Capesize component has risen from 1344 to 3924, 192 percent and the Panamax component has risen from 892 to 1415, 58 percent.
The MidShip report stated on September 11th, “The dry cargo freight market has been volatile over the past few months and as we go to press we expect that rates will get stronger moving into the 4th quarter. Having said that we still have a huge oversupply of vessels with more exiting the shipyards in Q4 and through 2014. However with economic improvements in the EU and momentum building in the US and China it appears that the supply demand ratio could soon balance for the first time in years leading to higher freight rates.” They go on to say, “We are surprised that the Suez Canal remains open as we were expecting sabotage or attacks on vessels in transit. Should the canal be closed there would be an immediate escalation in freight rates.”
The other aspect of vessel supply and demand is the rate of demolitions. Clarkson and Gilbson in the UK reported as follows this month; “Demolitions increased in 2012 reaching 56m dwt, compared with 41m dwt in 2011 and 26m dwt in 2010. It is not surprising that bulk carriers dominated the demolition market as owners continued to clear out tonnage which had limped through the previous few years. The 32 percent increase in demolition in 2012 is further evidence that market pressure is increasing, reinforced by the economic pressures of high priced oil. In 2014 it is expected that demolitions should exceed new deliveries and, consequently should work in favor of the supply demand balance.”
Road freight
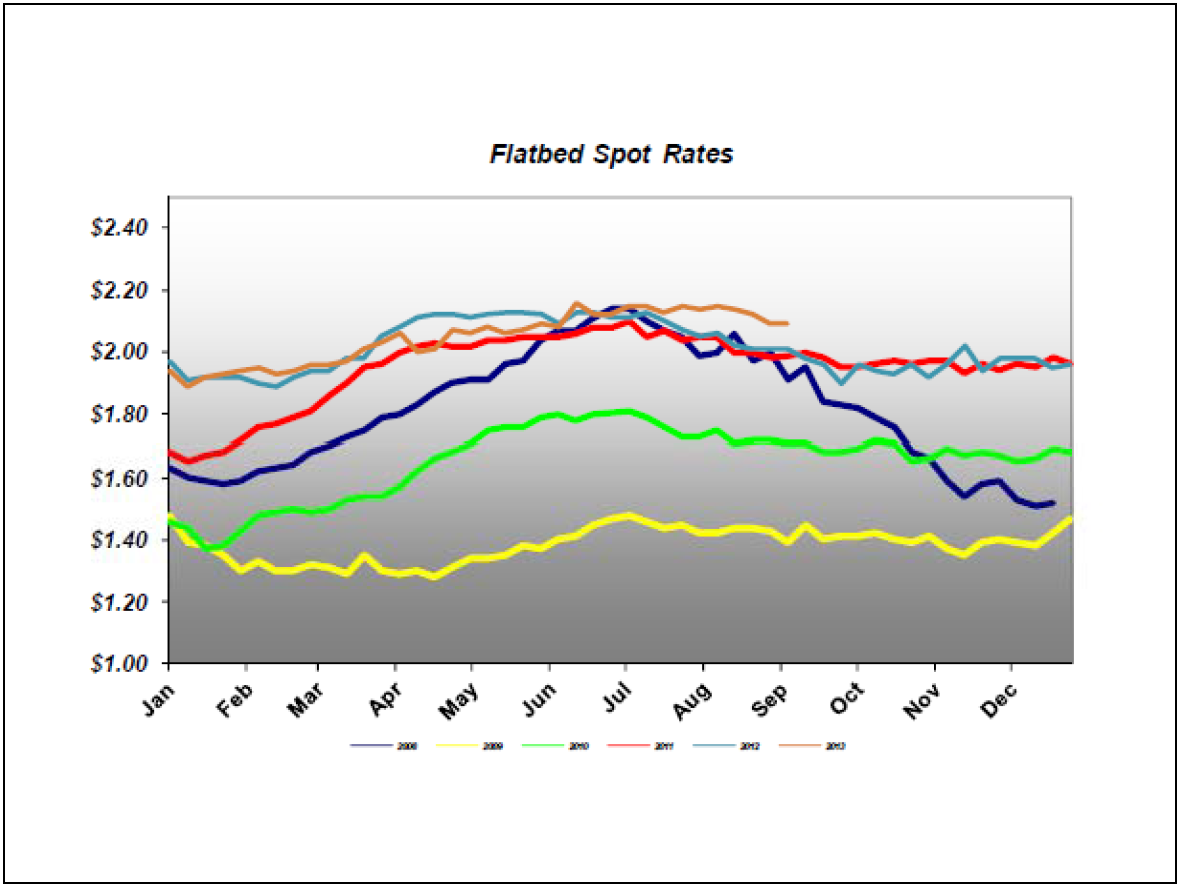
The Cleveland research Company reported as follows on September 6th. “During August, spot market demand for trucking services dropped gradually throughout the month, following normal seasonal trends. Most shippers were able to cover freight under contract agreements, rather than utilizing brokers in order to secure capacity. Macro-demand remains sluggish and commentary surrounding an expected second half recovery has moderated with many industry participants now focused on 2014.
Through August, flatbed rates in the spot market were $2.11 per mile, up 4.8 percent Y/Y, as capacity remained constrained (Figure 2). Most flatbed carriers have delayed rate increases that were intended to be put in place during 1Q as a weak steel market has offset strength in construction and building products. Many carriers plan to implement rate increases no sooner than 1Q14.
In August, the percentage of sources reporting more available flatbed capacity fell slightly after three stable months. Industry commentary indicates that demand has ticked up in the past 4-6 weeks, and capacity remains a concern for shippers. Increased government regulation (CSA, HoS, EOBRs) continues to limit any meaningful growth of available drivers.
The American Trucking Associations’ advanced seasonally adjusted Truck Tonnage Index improved 4.7 percent year-over-year in July, following a 5.9 percent year-over-year gain in June. Year-to-date tonnage is up 4.7 percent versus 2012. The index was down slightly month over month in July, contracting 0.4 percent. Commentary through August continues to indicate y/y tonnage gains, with improvement called out among flatbed carriers. Freight continues to move largely on contract agreements as shippers and carriers avoid the spot market.
Rail Freight
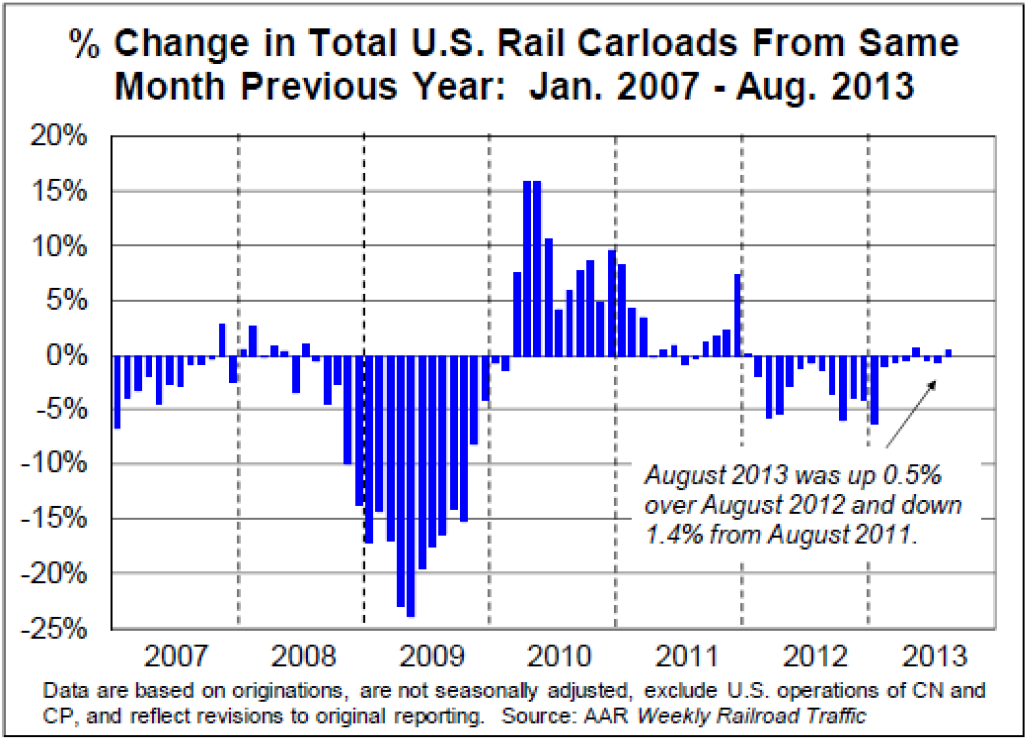
The Association of American Railroads reported on September 6th: “U.S. railroads averaged 294,655 carloads per week in August 2013, up 0.5 percent over August 2012 and the highest weekly average for any month since November 2011.” For the past seven months, carloads have deviated only very slightly from the same periods in 2012 (Figure 3). The total for the month of August was 1,178,619, up 5,285 carloads from August 2012. The commodity category with the largest year-over-year increase in August 2013 was petroleum and petroleum products; with carloads up 18.5 percent (8,148 carloads) over August 2012 this category includes crude oil along with LPGs, fuel oil, and a variety of other petroleum-related products, though the vast majority of the increase in this category over the past couple of years is due to growth in crude oil shipments.
Coal and grain led the way for carload declines in August 2013, just as they have for many months now. Coal carloads were down 9,915 (2.0 percent) in August 2013 compared with August 2012, while grain carloads were down 6,570 (9.0 percent). In addition to coal and grain, commodities with fewer carloads in August 2013 than in August 2012 include metallic ores (down 5,698 carloads, or 18.5 percent and grain mill products (down 1,727 carloads, or 4.7 percent — this category includes flour, animal feed, corn syrup, soybean meal, and dried distillers grains, among other things).
Carloads of “industrial products,” an aggregation of several commodity categories including steel, chemicals, and paper, were up 3.7 percent in August 2013 over August 2012.
SMU Comment
We are currently experiencing large changes in the ocean and rail freight markets. The ocean freight supply demand balance is coming back in line as demolitions catch up with new capacity which will strengthen freight rates at least through 2014. Rail freight is being influenced strongly by changes in the US energy market. Fracking is increasing the supply of domestic gas and oil. Natural gas is replacing coal as the preferred energy source for power generation to the detriment of the railroads. At the same time the transportation of newly discovered oil in the US and of product from the Alberta tar sands is boosting rail traffic. As arguments about the Keystone pipeline roll on, the railroads are picking up the slack. The flatbed truck market seems stable by comparison.


