

Market Data
October 17, 2013
SMU Steel Buyers Sentiment Index at +38
Written by John Packard
Based on responses from the Steel Market Update (SMU) mid-October steel market survey, SMU Steel Buyers Sentiment Index is +38 and is considered to represent an optimistic view of the industry by those buying and selling flat rolled steel products. The latest reading is up one point over our early October measurement but is one point lower than one month ago. Last year at this time Sentiment was measured at +9 – what a difference a year makes.
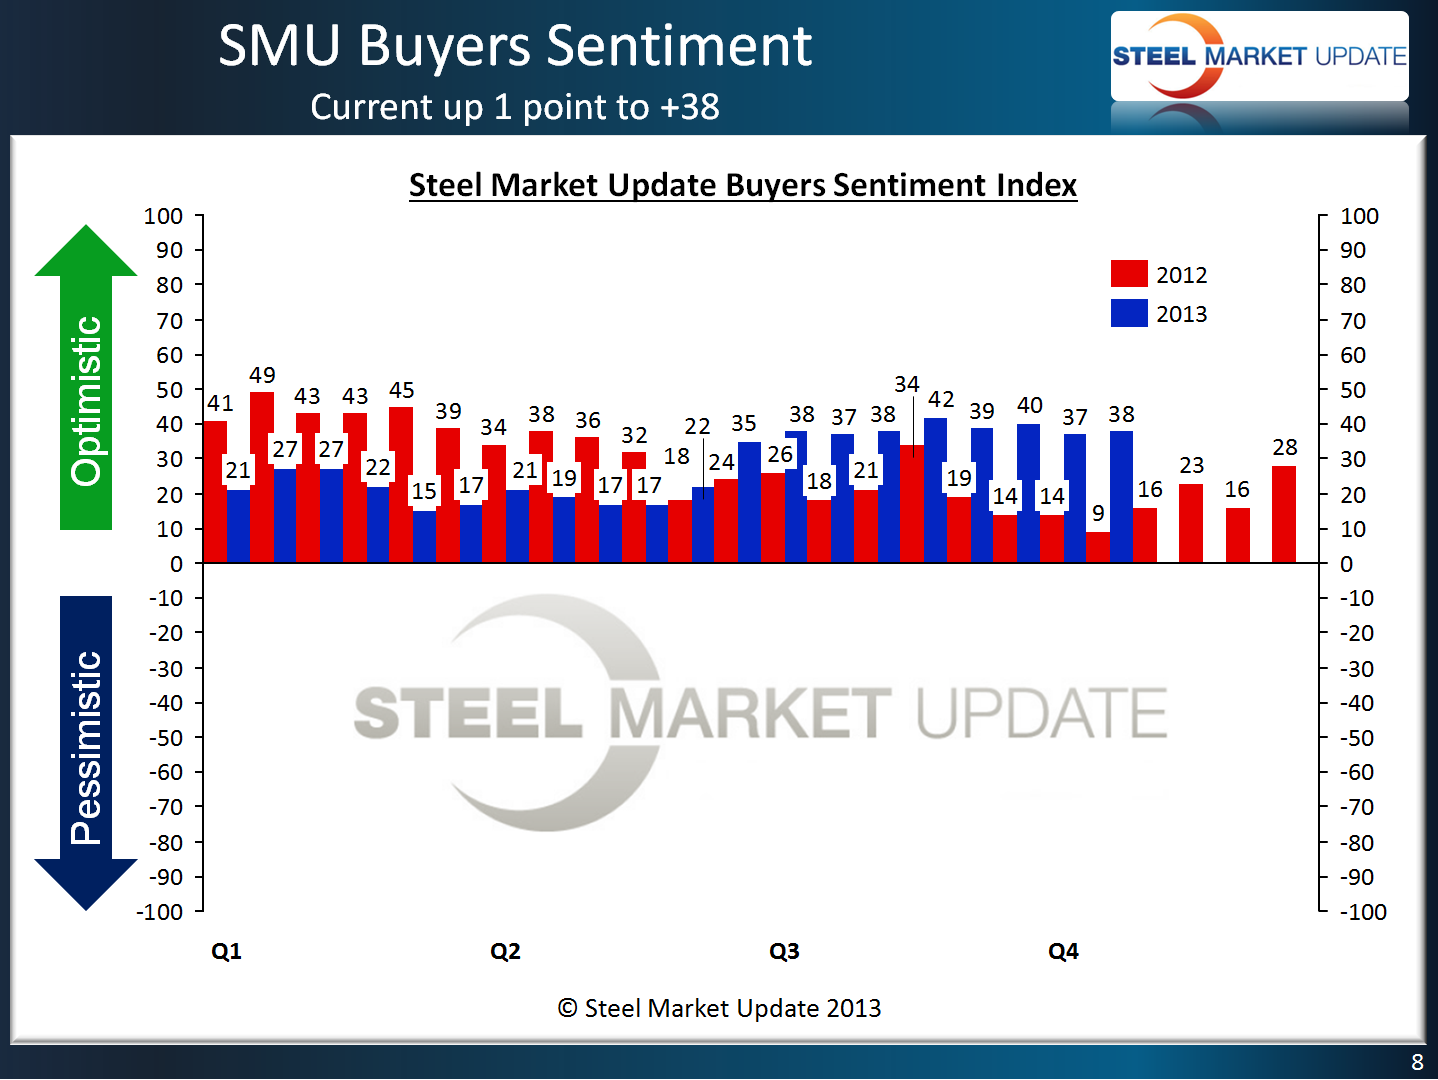
The three month moving average (3MMA) is now +39.00 and is the same as the mid-September reading. The 3MMA average one year ago was +18.50.
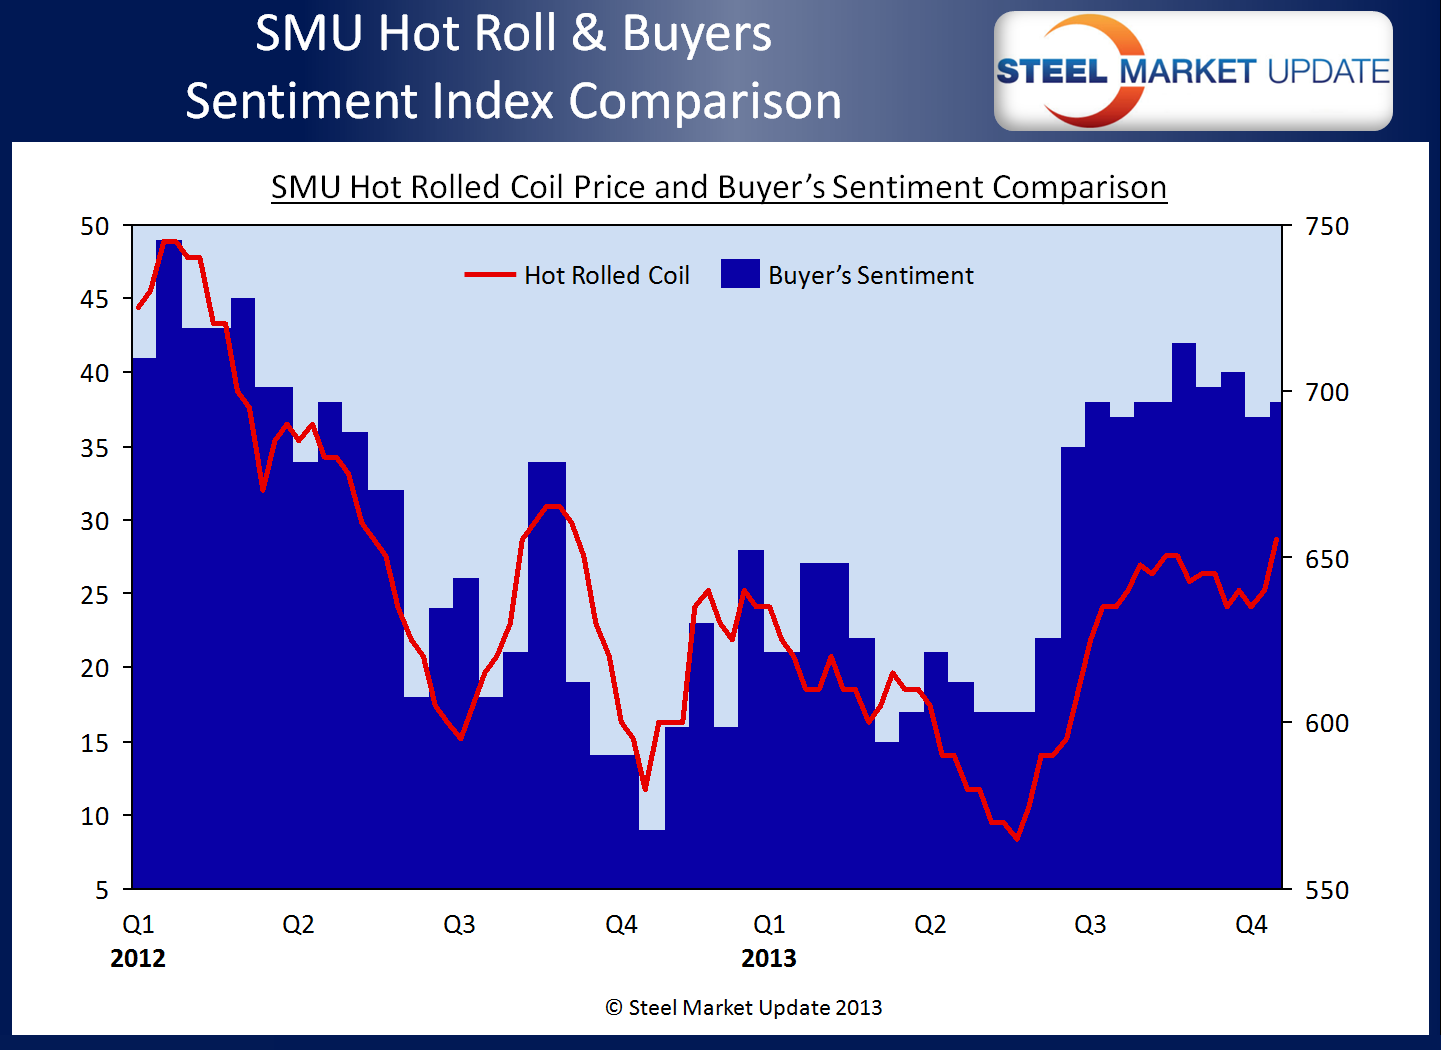
Here is a comparison of the SMU Steel Buyers Sentiment Index and hot rolled pricing (remember all snapshot pictures and graphics are “clickable” so you can review them in more detail):
Future Sentiment at +50
Our Future Steel Buyers Sentiment Index – looking out 3 to 6 months into the future – continued at a very optimistic +50. Future Sentiment is down 1 point over 2 weeks ago but is well above the +35 reported during the middle of October 2012.
What Buyers/Sellers of Steel are Saying
Buyers and sellers of flat rolled steel reported business conditions as flat to improving (albeit modestly) and steel prices as rising thus increasing the value of their inventories.
During the survey process a number of buyers and sellers of steel who participate in our survey left behind comments regarding the current business environment. Most of the comments left were from construction related manufacturing companies:
A manufacturing company associated with the construction segment of the steel markets told us during the survey process, “On the commercial construction side there isn’t much new activity. We’re living off of old work and having to scramble to keep everyone busy. It’s forcing us to be more efficient and effective as a company but it’s definitely making life more difficult for our sales force.” This manufacturer reported demand as being “fair.”
“There are so many unknowns in business today. I think there are a lot of companies trying to put on the good face and saying things are good when under the water their duck feet are pedaling 100 mph trying to figure out a direction to take to improve their business outlook,” is what a second manufacturing company associated with the construction industry told SMU. This manufacturing company also reported demand as being “fair.”
“The seasonality of metal building components is starting to affect the market.” This manufacturing company reported demand as being in decline.
“Instead of 2 good days, 1 bad it’s becoming 3 good 1 bad. no leaps in increased business, small ticks.” Construction related manufacturing company who reported demand as improving.
“Business conditions are OK, but buyers are holding off on transactions hoping that prices will come down.” From a service center who reported demand as being in decline due to contractual negotiations and uncertainty about prices moving forward.
About the SMU Steel Buyers Sentiment Index
SMU Steel Buyers Sentiment Index is a measurement of the current attitude of buyers and sellers of flat rolled steel products in North America regarding how they feel about their company’s opportunity for success in today’s market. It is a proprietary product developed by Steel Market Update for the North American steel industry.
Positive readings will run from + 10 to + 100 and the arrow will point to the right hand side of the meter located on the Home Page of our website indicating a positive or optimistic sentiment.
Negative readings will run from -10 to -100 and the arrow will point to the left hand side of the meter on our website indicating negative or pessimistic sentiment.
A reading of “0” (+/- 10) indicates a neutral sentiment (or slightly optimistic or pessimistic) which is most likely an indicator of a shift occurring in the marketplace.
Readings are developed through Steel Market Update market surveys which are conducted twice per month. We currently display the index reading on a meter on the Home Page of our website for all to enjoy.
Currently we send invitations to slightly more than 600 North American companies to participate in our survey. Our normal response rate is approximately 125-175 companies. Of those responding to this week’s survey 47 percent were manufacturing companies (down 3 percent from the previous survey’s 50 percent), 42 percent were service centers/distributors (up 3 percent from 39 percent at the beginning of September) and the balance was made up of steel mills, trading companies, toll processors and suppliers to the industry (such as paint companies).
Steel Market Update does canvass those being invited to participate in order to confirm their active participation in the flat rolled steel business. Our list is updated at least once per month and we are adding new companies on a continuous basis.
Written by: John Packard
Based on responses from the Steel Market Update (SMU) mid-October steel market survey, SMU Steel Buyers Sentiment Index is +38 and is considered to represent an optimistic view of the industry by those buying and selling flat rolled steel products. The latest reading is up one point over our early October measurement but is one point lower than one month ago. Last year at this time Sentiment was measured at +9 – what a difference a year makes.
The three month moving average (3MMA) is now +39.00 and is the same as the mid-September reading. The 3MMA average one year ago was +18.50.
Here is a comparison of the SMU Steel Buyers Sentiment Index and hot rolled pricing (remember all snapshot pictures and graphics are “clickable” so you can review them in more detail):
Future Sentiment at +50
Our Future Steel Buyers Sentiment Index – looking out 3 to 6 months into the future – continued at a very optimistic +50. Future Sentiment is down 1 point over 2 weeks ago but is well above the +35 reported during the middle of October 2012.
What Buyers/Sellers of Steel are Saying
Buyers and sellers of flat rolled steel reported business conditions as flat to improving (albeit modestly) and steel prices as rising thus increasing the value of their inventories.
During the survey process a number of buyers and sellers of steel who participate in our survey left behind comments regarding the current business environment. Most of the comments left were from construction related manufacturing companies:
A manufacturing company associated with the construction segment of the steel markets told us during the survey process, “On the commercial construction side there isn’t much new activity. We’re living off of old work and having to scramble to keep everyone busy. It’s forcing us to be more efficient and effective as a company but it’s definitely making life more difficult for our sales force.” This manufacturer reported demand as being “fair.”
“There are so many unknowns in business today. I think there are a lot of companies trying to put on the good face and saying things are good when under the water their duck feet are pedaling 100 mph trying to figure out a direction to take to improve their business outlook,” is what a second manufacturing company associated with the construction industry told SMU. This manufacturing company also reported demand as being “fair.”
“The seasonality of metal building components is starting to affect the market.” This manufacturing company reported demand as being in decline.
“Instead of 2 good days, 1 bad it’s becoming 3 good 1 bad. no leaps in increased business, small ticks.” Construction related manufacturing company who reported demand as improving.
“Business conditions are OK, but buyers are holding off on transactions hoping that prices will come down.” From a service center who reported demand as being in decline due to contractual negotiations and uncertainty about prices moving forward.
About the SMU Steel Buyers Sentiment Index
SMU Steel Buyers Sentiment Index is a measurement of the current attitude of buyers and sellers of flat rolled steel products in North America regarding how they feel about their company’s opportunity for success in today’s market. It is a proprietary product developed by Steel Market Update for the North American steel industry.
Positive readings will run from + 10 to + 100 and the arrow will point to the right hand side of the meter located on the Home Page of our website indicating a positive or optimistic sentiment.
Negative readings will run from -10 to -100 and the arrow will point to the left hand side of the meter on our website indicating negative or pessimistic sentiment.
A reading of “0” (+/- 10) indicates a neutral sentiment (or slightly optimistic or pessimistic) which is most likely an indicator of a shift occurring in the marketplace.
Readings are developed through Steel Market Update market surveys which are conducted twice per month. We currently display the index reading on a meter on the Home Page of our website for all to enjoy.
Currently we send invitations to slightly more than 600 North American companies to participate in our survey. Our normal response rate is approximately 125-175 companies. Of those responding to this week’s survey 47 percent were manufacturing companies (down 3 percent from the previous survey’s 50 percent), 42 percent were service centers/distributors (up 3 percent from 39 percent at the beginning of September) and the balance was made up of steel mills, trading companies, toll processors and suppliers to the industry (such as paint companies).
Steel Market Update does canvass those being invited to participate in order to confirm their active participation in the flat rolled steel business. Our list is updated at least once per month and we are adding new companies on a continuous basis.


