

Prices

October 30, 2013
Imports of Semi Finished & Hot Worked Steel Imports
Written by Peter Wright
The 3 month moving average (3MMA) of imports of the combined tonnage of billets, blooms and slabs through September reached the highest level since February last year. We use the 3MMA to avoid getting too wrapped up in a single months numbers which can be a fruitless exercise. On the same basis flat rolled products were the highest since July 2012 and long products have been drifting up erratically since June 2012. These conclusions include September license data, August final and July final data (Figure 1). We believe it is valid to combine preliminary and license data in this way because both have a good track record of closely approximating the final data and at this macro level of analysis we are concerned more with direction that we are with absolutely accurate numbers.
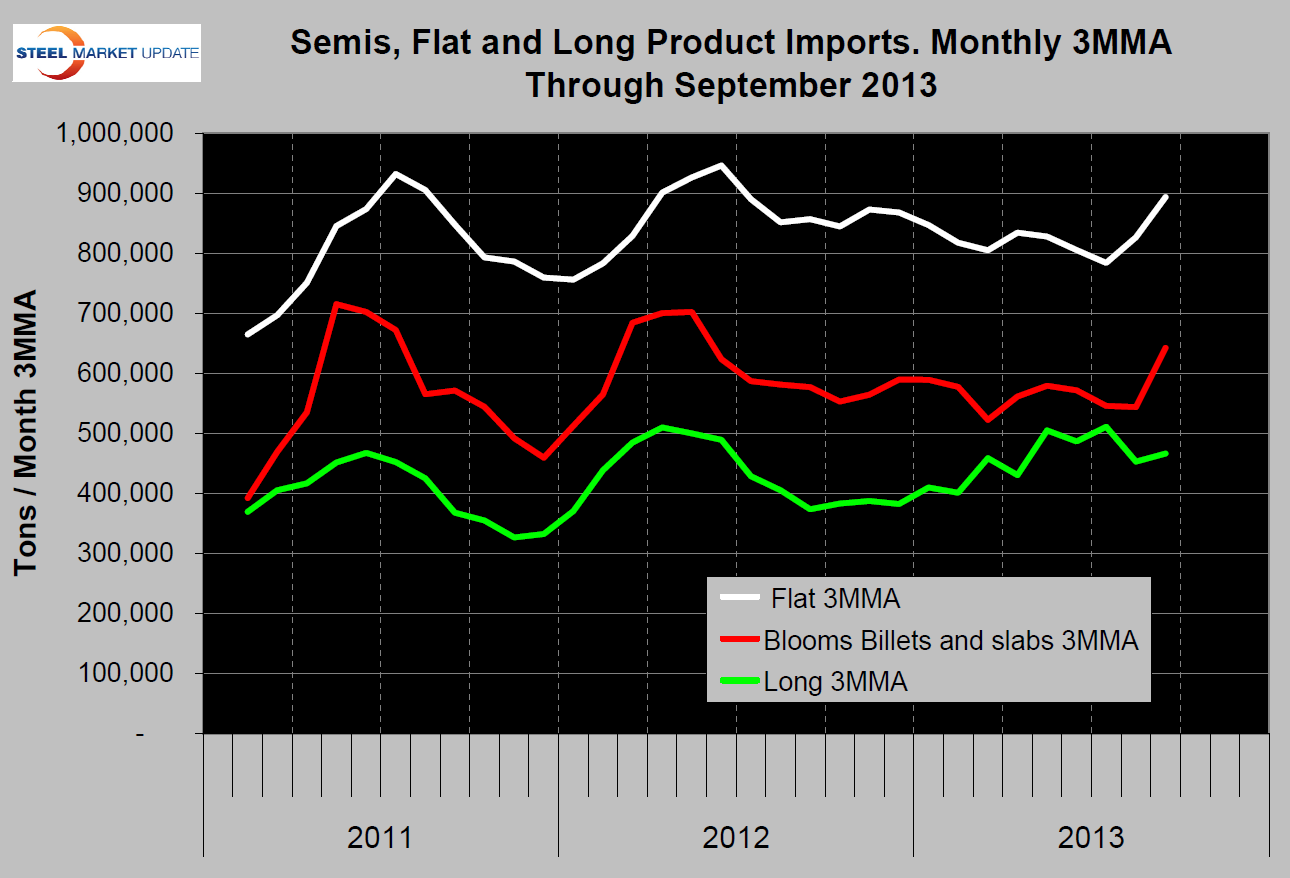 Table 1 provides a detailed import analysis and compares the average monthly tonnage of the three months through September, (Q3) with both the same period last year and with three months through June (Q2). The total tonnage of all hot worked products averaged 1,969,310 tons per month in three months through September, down by 59,570 tons from Q3 last year (Table 1). This sounds contradictory compared to the comments above about the trends shown in Figure 1 which is why it’s necessary to look at both the graph and the table to get the complete picture. Comparing Q3 with Q2 this year hot rolled sheet and strip combined were up by 28.5 percent and up by 17.4 percent year over year. Cold rolled and coated products except tin plate were all down Q3 /Q2. Detail for individual products is included in table 1.
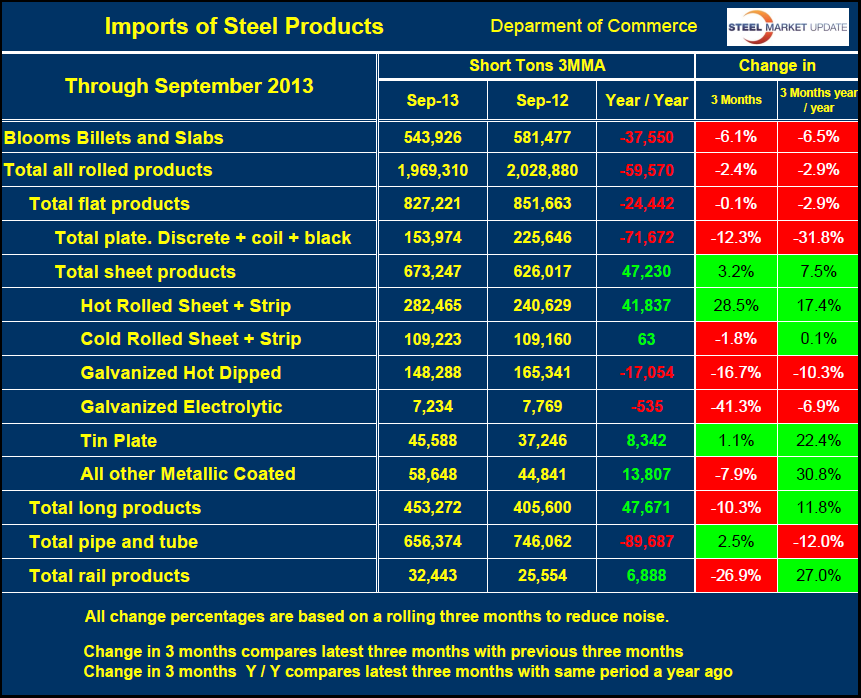
Explanation: In order to reduce noise in the data it’s better to compare rolling three month periods which gives a real feel of trade flows. License data does not include district of entry so those details are delayed by an additional month. We believe that both a table and a graph are necessary because they provide a quite different but complimentary picture. The table is a snapshot of product detail with a short time element. The graph provides much less detail but gives a longer term perspective which is essential in understanding the current situation. SMU will continue the very detailed analysis of tonnage by source country and port of entry for individual sheet products through the final August tonnages in later issues of our Premium service version of this newsletter.


