

Market Data

December 22, 2013
SMU Comparison Price Indices: A New Look and Data for 2014
Written by John Packard
Steel Market Update continues to expand and one of the areas we are looking to expand into is the world of plate. As we enter the New Year we will begin indexing discreet plate pricing as we do hot rolled, cold rolled, galvanized and Galvalume steels.
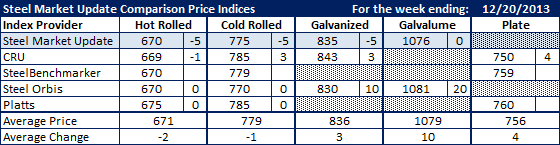
We also are changing our CPI (Comparison Price Indices) table. The new look is shown below. Included is the plate pricing, next to each item is the weekly price movement and at the bottom is the average of all the numbers collected and the weekly change for the group.
For the week we found only small movements in pricing with the exception of Steel Orbis which adjusted their galvanized number up $10 to $830 per ton and their Galvalume number up $20 to $1081 per ton (galvanized is based on .060” G90 and Galvalume is .0142” AZ50, Grade 80).
FOB Points for each index:
SMU: Domestic Mill, East of the Rockies.
CRU: Midwest Mill, East of the Rockies.
SteelBenchmarker: Domestic Mill, East of the Mississippi.
SteelOrbis: Midwest Domestic Mill.
Platts: Within 200-300 mile radius of Northern Indiana Domestic Mill.


