Market Data

February 20, 2014
Service Center Apparent Excess Rises to 150,000 NT
Written by John Packard
Based on the most recent MSCI flat rolled steel data Steel Market Update has calculated that U.S. service centers grew their “Excess” inventories from +2,000 tons at the end of December to +150,000 ton at the end of January. The “Apparent Excess” is based on a proprietary model which projects future shipments and inventory levels at the domestic distributors.
As you can see by the graphic below (which is available as an interactive chart on our website) January shipments were relatively flat compared to the prior January (3,648,200 total flat rolled tons vs. 3,643,600 tons last January). The chart shows that prior to January we had eight months where total flat rolled shipments exceeded the prior year which helped reduce the Apparent Deficit to basically zero (+2,000 tons) by the end of December.
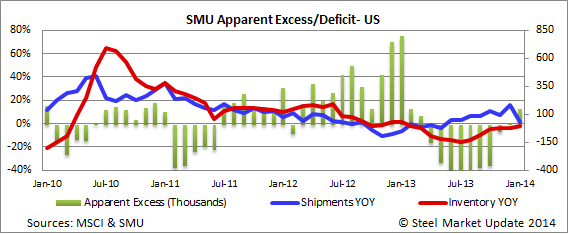
We believe inventories to be basically balanced at the service centers even with the +150,000 ton Excess which was slightly higher than our forecast of +36,000 tons which we shared with our Premium Level members last month. We share our current forecast at the end of this article (along with our prior forecast for those keeping score). Not to make excuses but we believe our forecast would have been dead on for January if not for the lost shipping days service centers had to endure due to weather related events.
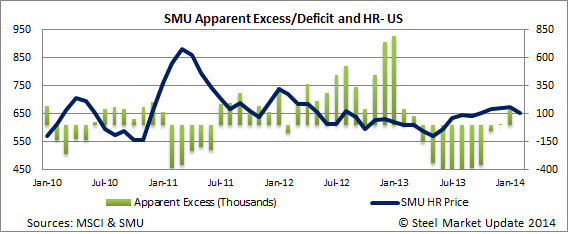
Benchmark hot rolled prices have begun to decline since January 8th when the SMU HRC average was $680 per ton. Our current average is $645 down $35 per ton from the peak. Through our SMU Price Momentum Indicator which is currently set a “Lower” we feel HRC prices will continue to decline over the next 30 days. Should inventory levels grow faster than we anticipate this could help push prices lower at an expedited pace.
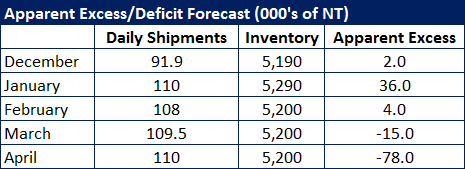
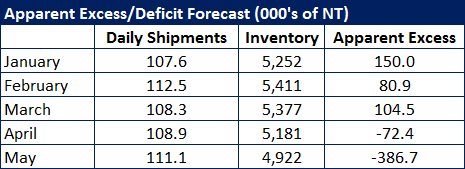
We anticipate shipment levels to improve slightly with only modest growth in inventories during the month of February. Our forecast is for the Apparent Excess to continue but at a slightly lower level (+80,900 tons).
Here is our current forecast followed by our previous forecast:
And our prior forecast: