Market Data

March 13, 2014
Net Steel Trade through January 2014
Written by Peter Wright
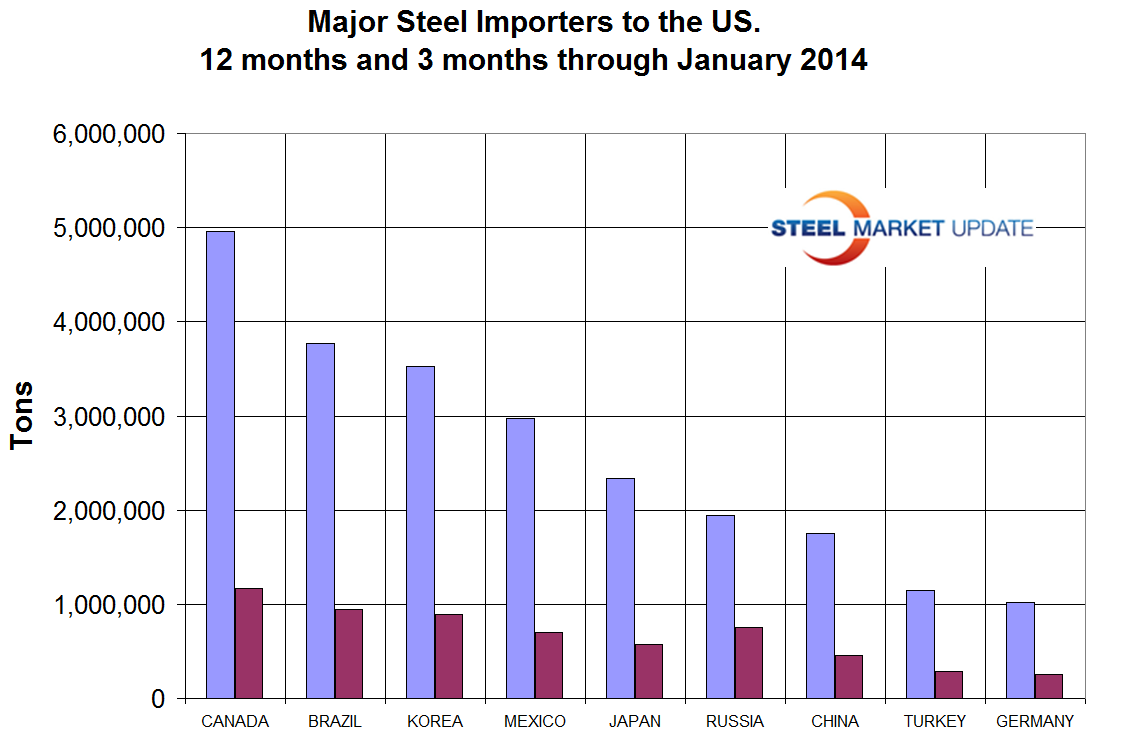
Canada was the highest volume exporter of all carbon and low alloy steel products to the US in both the last 12 and 3 month periods through January with 4,956,812 and 1,172,616 tons respectively (Figure 1). Mexico came in 4th in 12 months after Brazil and Korea but was bumped into 5th place by Russia in the last three months. These figures include semi-finished.
 The US steel industry pays a lot of attention to imports, rightly so, but at SMU we believe a net trade analysis is also important because it shows how much trade pressure or relief is being experienced by individual products.
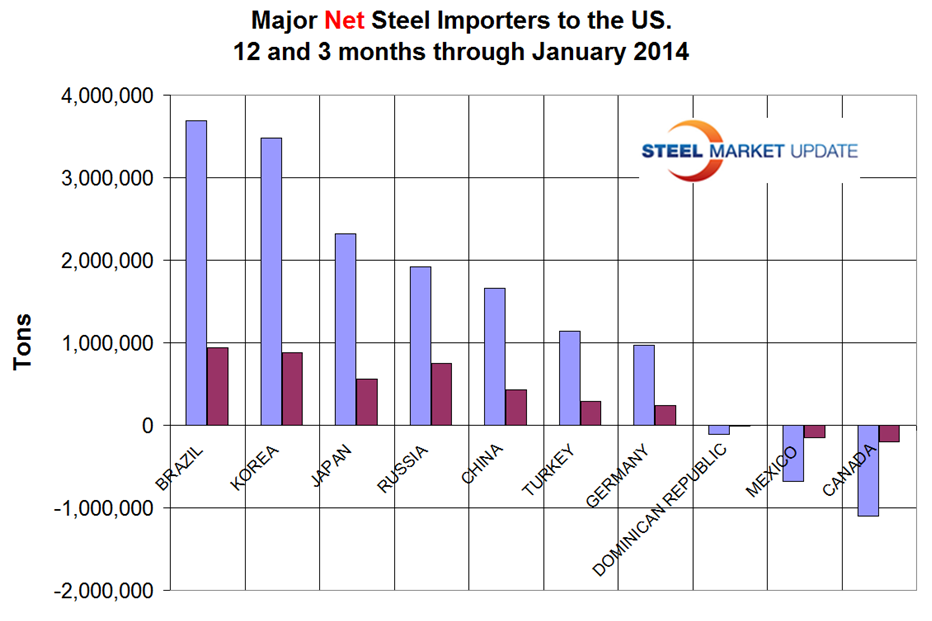
Net imports of all carbon and low alloy products including semis in three months through January was 5,017,611. This was made up of 7,533,807 tons of imports and 2,516,196 tons of exports. The net trade picture is quite different from the one dimensional import report. Canada morphed from the highest volume source to the exact opposite on the net imports scale. Canada and Mexico are both net importers FROM the United States. The US had a net steel trade surplus with Canada of 1,095,220 tons and with Mexico of 680,007 tons in 12 months through January. Clearly a large volume of steel goes both ways across the NAFTA borders. Brazil and Korea had by far the largest trade surplus with the US with 3,689,613 and 3,476,759 tons respectively over the 12 months through January (Figure 2).
 Net imports of all steel products in the three months through January increased by 168,656 tons per month compared to the same period a year ago. The net imports of all sheet products increased by 67,566 tons per month on the same basis. Table 1 shows net steel imports through January for all steel products, for sheet products in detail and is organized to show the year over year change in three months through January and year to date. Net imports increased for all sheet products except tin plate in both time frame comparisons. In the case of electrolytic galvanized this was manifested as a decrease in trade surplus. Comparing net imports for January with the monthly average for October through January shows a deterioration for all sheet products except tinplate. For example the monthly average net volume for all sheet products in October through January was 67,566 tons but for January alone was 191,791 tons.
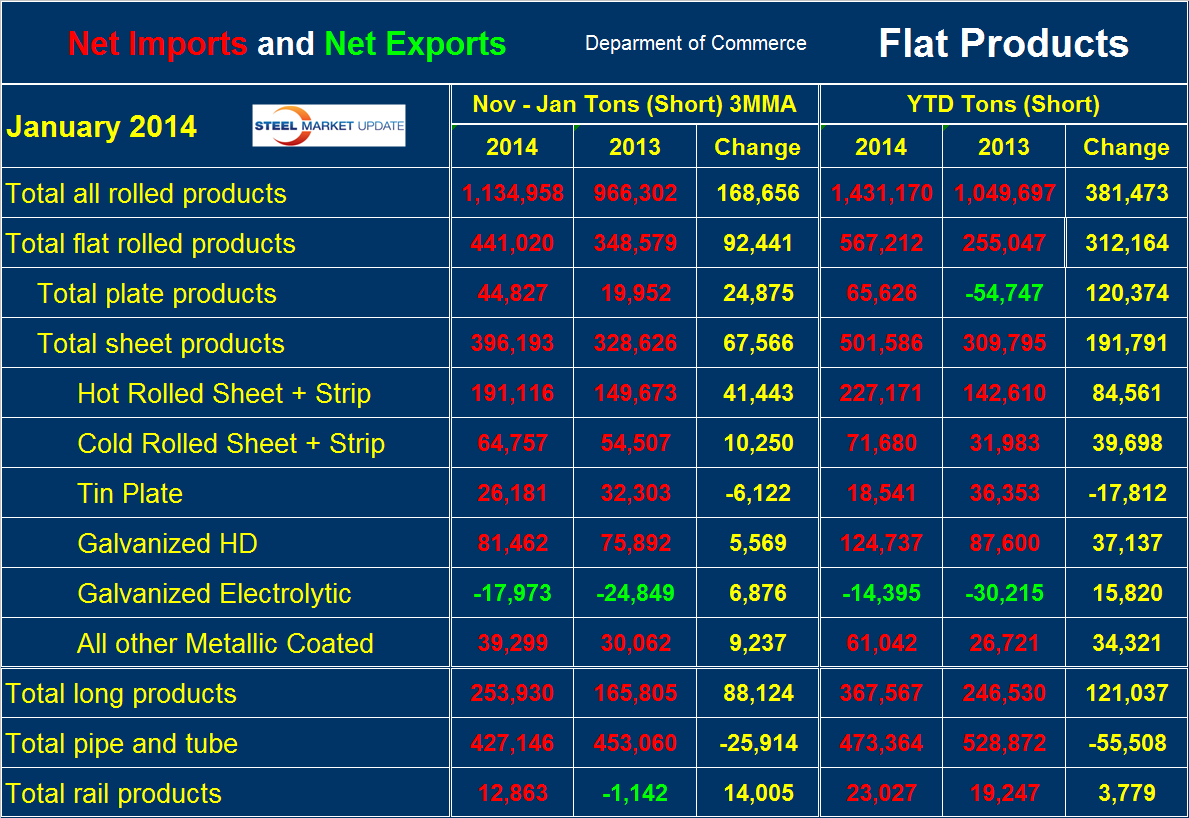
 Other significant changes year over year in January are that net plate imports (the total of coil and discrete) changed from a trade surplus of 54,747 tons in 2013 to a deficit of 65,626 in 2014. The deficit of total long products increased by almost 50 percent and of pipe and tube declined by 10.5 percent.
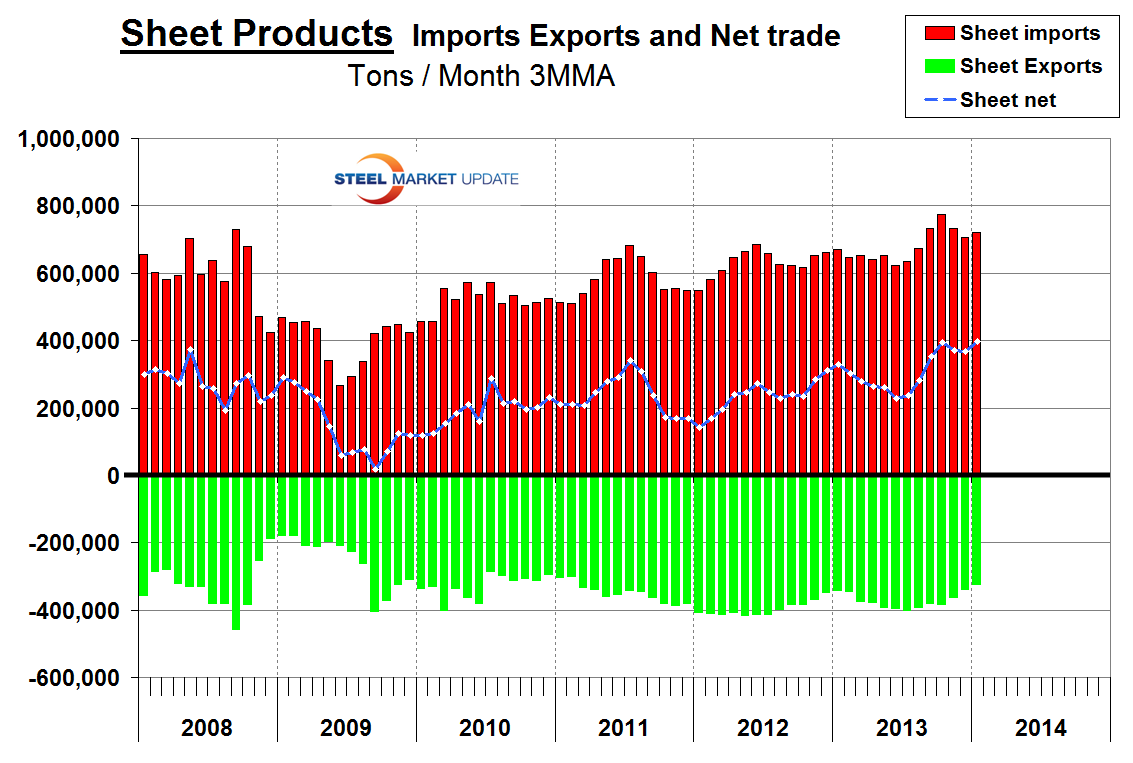
Figure 3 is an examination of the net trade of sheet products over a longer time period on a rolling three month basis. It confirms the year over year change described above but also indicates that net imports of sheet have been steadily increasing for 24 months.