Market Segment
March 18, 2014
Service Center Intake, Shipments and Inventory in February 2014
Written by Peter Wright
Total service center carbon steel shipments in February declined by 225,000 tons but this was because shipping days declined by two to twenty. Tons per day (t / d) shipments rose from 158,500 tons in January to 161,600 in February. Intake was 162,820 t / d leading to a monthly surplus of 24,400 tons and an inventory increase of the same amount. Months on hand rose from 2.32 to 2.51.
Table 1 shows the performance by product in the period December through February compared to the same period in previous years. Shipments of all products on a t / d basis were down compared to two years ago but compared to one year ago sheet and plate improved. Long products (bar and structurals) and pipe and tube all declined year over year. Intake did not necessarily follow the same pattern as shipments. Only structurals had a t / d decrease in intake in three months through February.
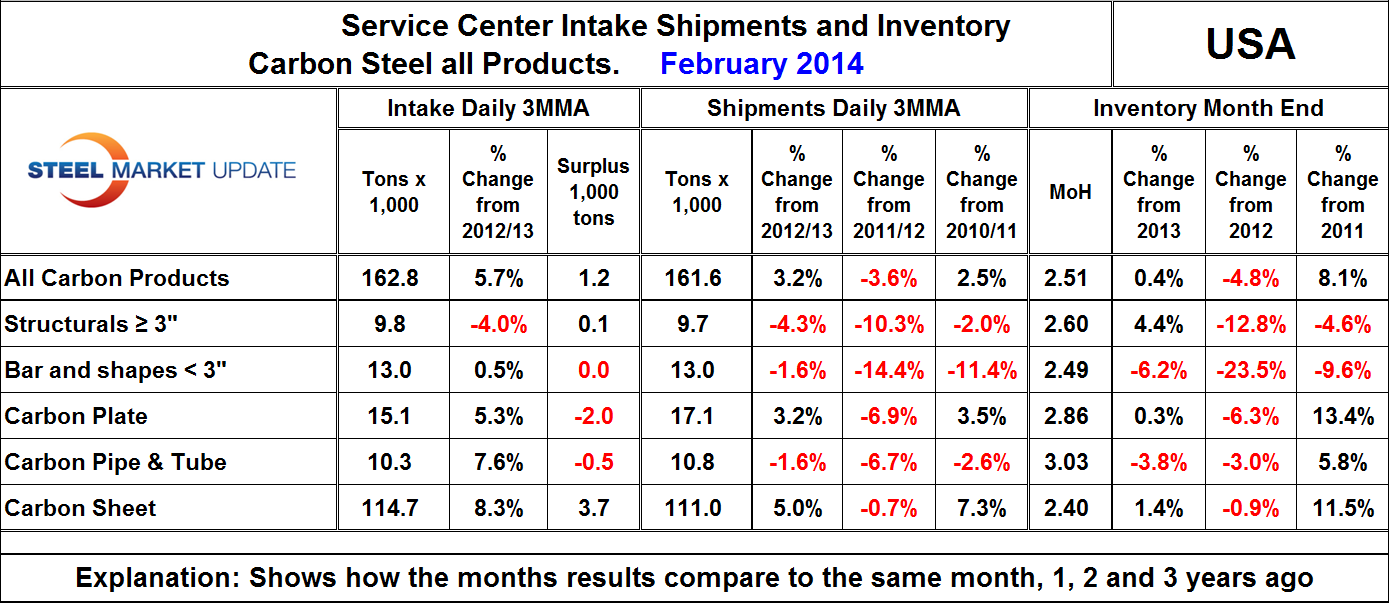
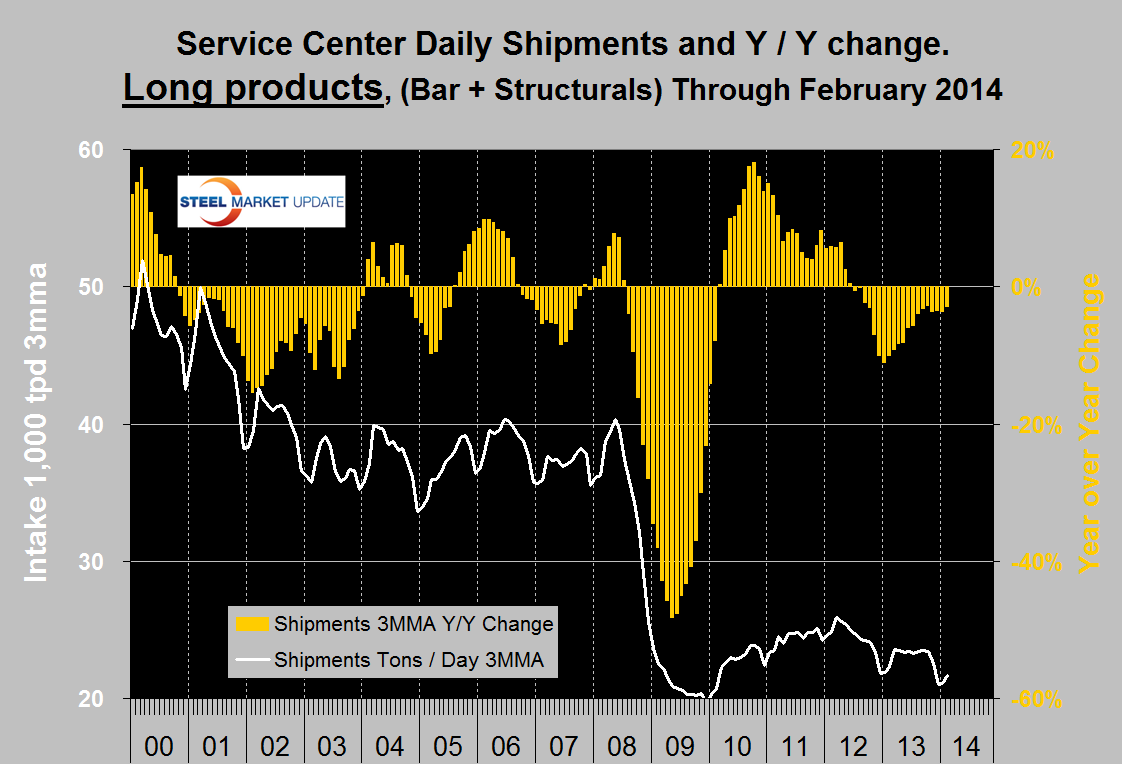
Compared to the end of February last year inventories were up by 0.4 percent in total, only bar and tubulars experienced a decrease. Sheet product inventories were up by 1.4 percent.There is a wide difference between the performance of flat rolled (sheet + plate) and long products (structural + bar) at the service center level. Long products had a very poor recovery from the recession and on a y / y basis have been declining once again for every one of the last 20 months (Figure 1).
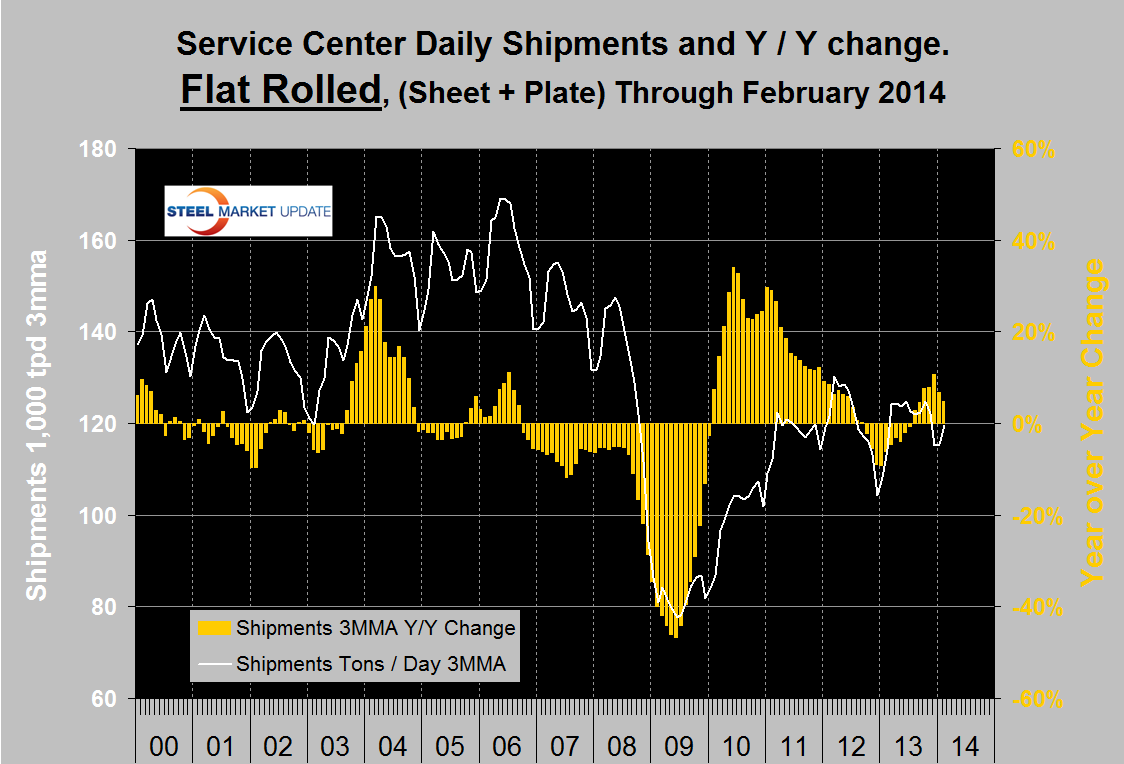
Flat rolled has had a much better recovery since mid-2009 and has had positive y / y growth in each of the last seven months (Figure 2). In 2006 and 2007, the good old days, the mills and service centers were operating at maximum capacity. Figure 3 takes the shipments by product since that time frame and indexes them to the average for 2006 and 2007 in order to measure the extent to which each product’s shipments from service centers has recovered. Again it can be seen that sheet and plate have fared best, bar and structurals the worst and tubulars in between. Sheet has had the best recovery and in February was at 84.8 percent of the 2006 /2007 average. Structurals are still only at 54.6 percent of where they were. The total of all carbon products is still only at 76.1 percent of the 2006 / 2007 average therefore is down by 23.9 percent. The recovery of the service center sector has been much slower than has been experienced by the mills. Based on product shipment data from AISI the average monthly carbon steel shipments from the mills in 2006 and 2007 was 8,612,596 tons. In Q4 2013 the average monthly mill shipments was 7,553,668 tons, a decline of 12.3 percent from 2006 /2007. Therefore it appears that service centers shipments are off by almost exactly twice the deficit being experienced by the mills. Presumably this is because in a relatively lack luster market, more buyers are by-passing service centers and buying mill direct and this is probably particularly true of long products. In addition long products being more construction oriented are suffering from prevailing conditions in that business sector.
MSCI uses product nomenclature flat and plate. In our analysis at SMU we replace the term flat with sheet. By our interpretation of the MSCI’s data our definition of sheet is all hot rolled, cold rolled and coated products. Since most of our readers are sheet oriented we have removed plate from Figure 3 to highlight the history of sheet products (Figure 4). Positive year over year growth has occurred in each of the last eight months following nine consecutive months of decline.
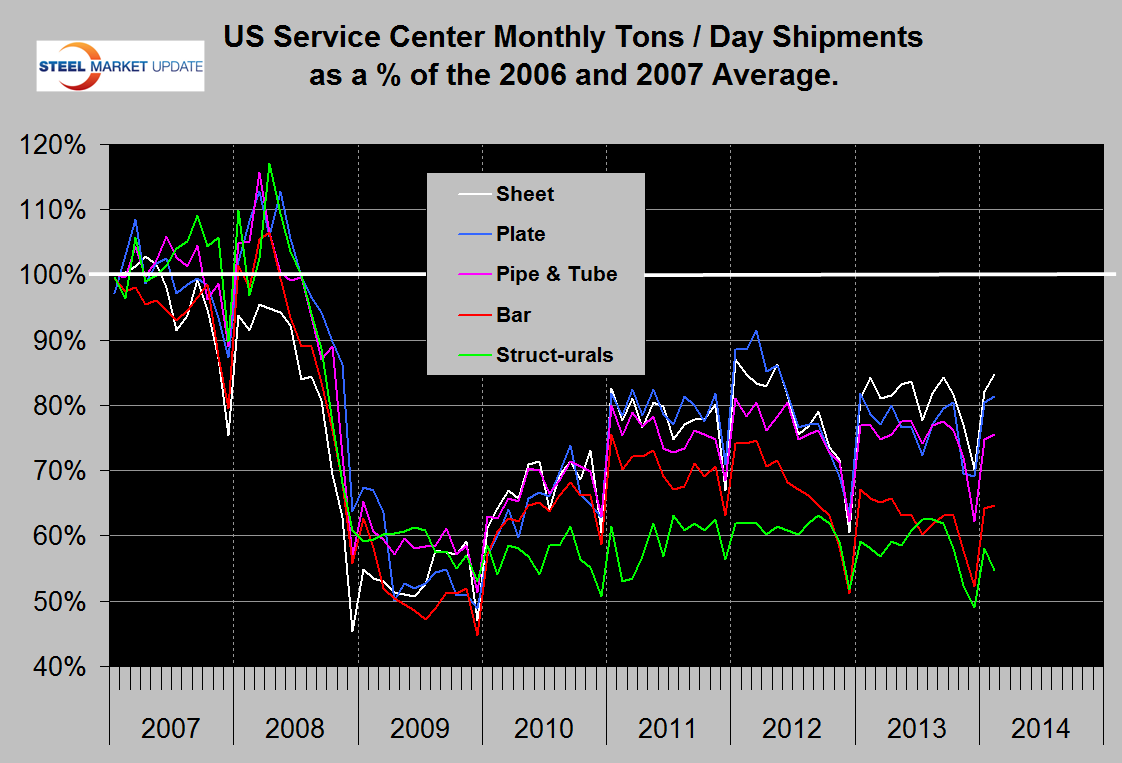
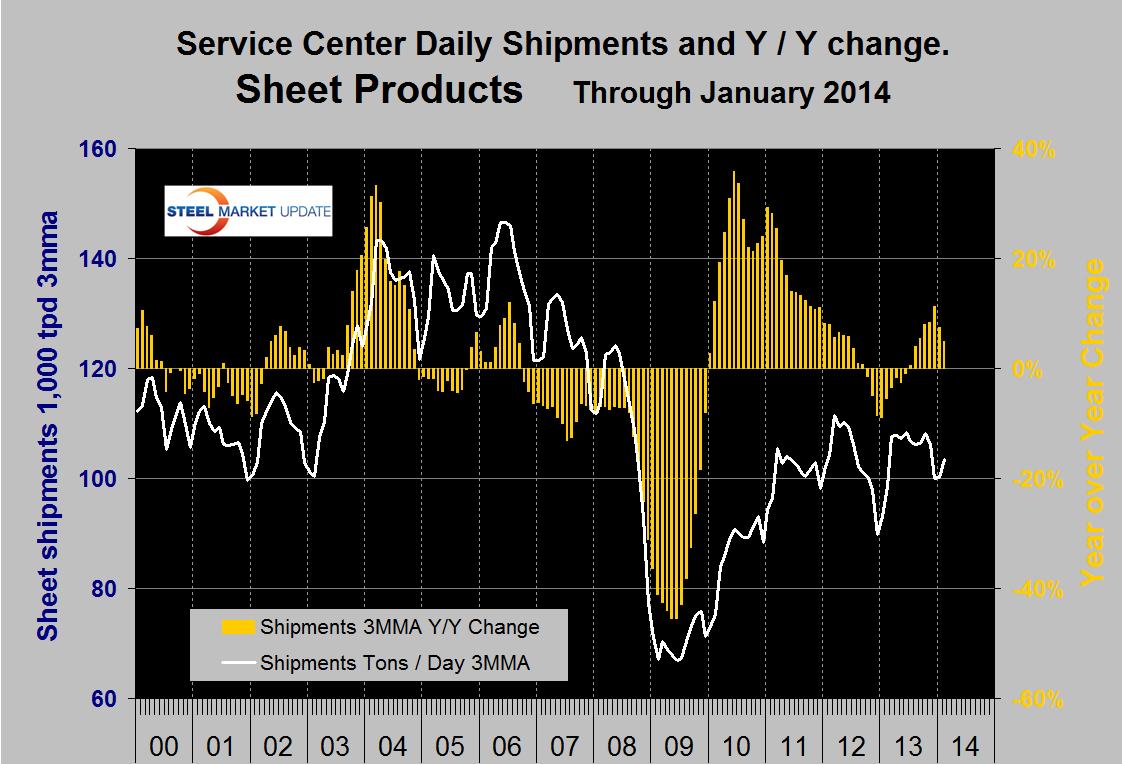
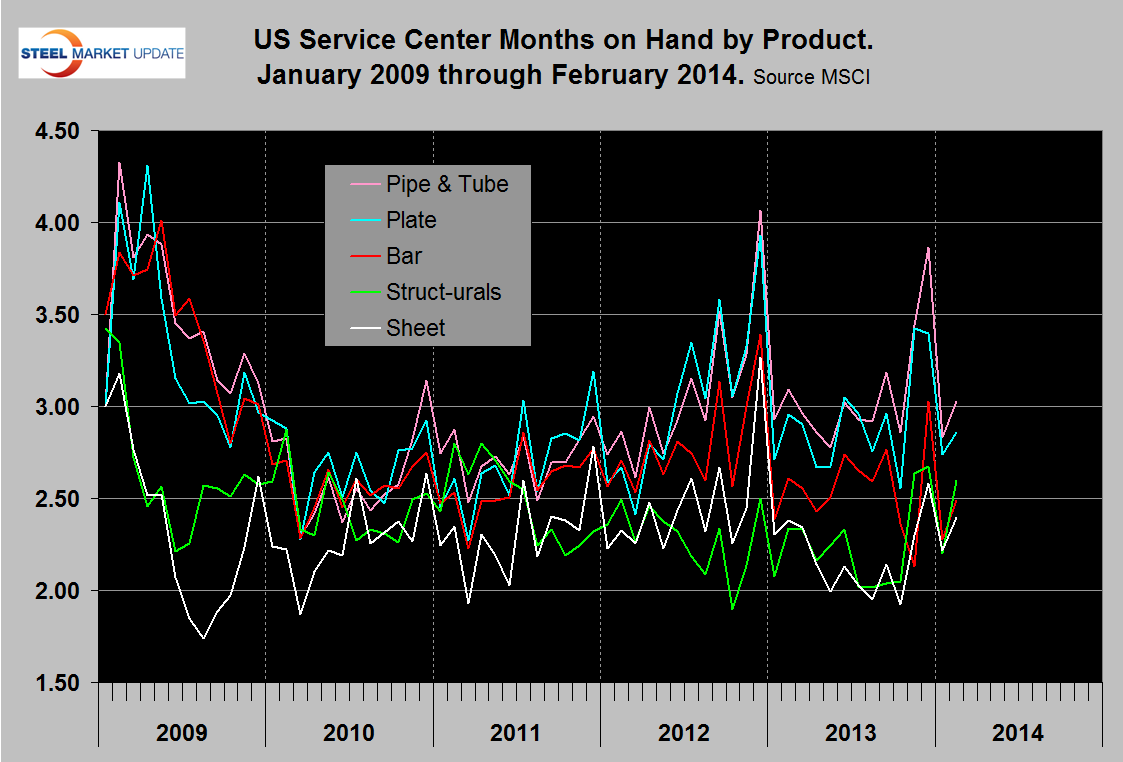
Figure 5 shows the change of inventory at service centers since 2009 measured as months on hand. Sheet products constitute by far the largest segment of service center’s business and they have had the best inventory management since 2009 and currently have the lowest months on hand.