

Market Data
March 31, 2014
Key Market Indicators - March 30th 2014
Written by Peter Wright
An explanation of the Key Indicators concept is given at the end of this piece for those readers who are unfamiliar with it.
The total number of indicators considered at present is thirty five, a decrease of one as the Chicago Fed Mid-West Manufacturing Index has been put on hold until late April to enable the staff to complete a major re-vamp of the structure of their report. Please refer to Table 1 for the view of the present situation and the quantitative measure of trends.
The present situation was unchanged from last month’s analysis. Twelve of the indicators based on historical standards were positive on March 30th and thirteen were negative with ten considered to be close to the historical norm. Twelve of the thirteen negative conditions were to be found in the steel and construction sectors. The general economy and manufacturing are with only one exception either positive or neutral. This broad look confirms that it is construction that is holding steel demand lower than is normal at this time in a cyclical recovery. The present situation of the general economy is OK with three indicators positive, four neutral and only consumer confidence being negative. The SMU buyer’s index and continues to be positive and the SMU service center excess is neutral meaning that companies took in more or less the same amount that they shipped. Present situation indicators for long and flat steel products are similar with shipments at both the mill and service levels being low by historical standards. One difference between the long and flat sectors is that net imports of long products are historically high and of flat products are neutral. Five of the negative present situation indicators relate to construction, none of the manufacturing indicators are currently negative, four are positive and two are neutral.
The quantitative analysis of the value of each indicator over time is shown in the “Trend” column. There has been a significant shift in a negative direction since this analysis was last published a month ago when twenty six indicators were trending positive and ten negative. On March 30th, twenty indicators were trending positive and fifteen negative. Trends in the general economy are improving with five of eight indicators heading in the right direction. This is a decrease of one from last month as consumer debt increased. The trend of the SMU steel buyer’s sentiment index continued to be positive and that of the service center surplus changed from negative to positive. In February service centers had a surplus of intake over shipments of 148,000 tons. In March this reversed with a deficit of 122,000 tons. We consider a deficit to be a positive for prices as inventories are not over loaded. In the long product steel sector both mill shipments and net imports reversed course. Shipments measured as 3 months total year over year improved from –50,000 tons in February to +94,000 tons in March. Net imports measured as a 3MMA month/month decreased by 11.4 percent in February but increased by 29.3 percent in March. Other trends maintained their direction for long products, including service center shipments which are trending down year over year. In the flat rolled sector four indicators trended negative in the last month and two positive which was a reversal of the breakdown reported in February. The changes were in mill shipments which on a 3 month basis y/y decreased by 689,000 tons compared to growth on the same basis of 1.036 million tons in February. Net imports increased in March by 7.9 percent on a 3MMA m/m basis.
In the construction sector, all indicators were trending positive in the February analysis which covered data releases through January. The February data reported this month showed that both residential and non-residential buildings went into contraction for the first time since mid-2011. Probably this was weather related so we anxiously await the spring updates. In the manufacturing sector one indicator reversed direction as manufacturing capacity utilization became slightly negative. Overall manufacturing had four positive trends and two negative in the latest data releases.
The key indicators analysis confirms our experience that the current market is not great but also that there has been a deterioration in trends since the February report. This is most likely due to the severe winter in much of the country. SMU has several benchmark analyses that show steel demand to be below the historical norm for this stage of a recovery. This is because the recession in non residential and housing construction was so extreme that it will be years before the 2007 levels are regained. In addition government funded infrastructure work is still depressed.
We believe a continued examination of both the present situation and direction will be a valuable tool for corporate business planning.
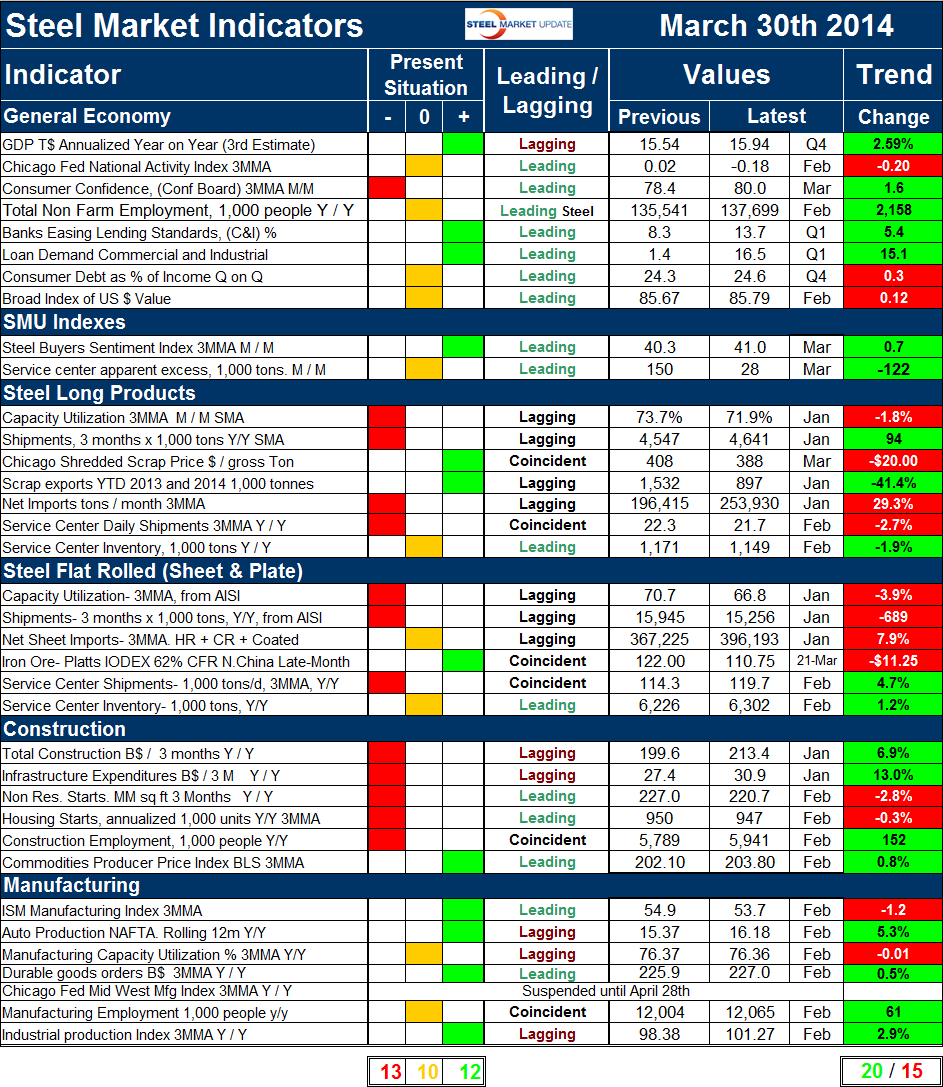
Explanation: The key indicators chart is designed to give a snapshot of the steel market on a specific date. The chart is stacked vertically to separate the primary indicators of the general economy, of proprietary Steel Market Update indices, of both flat rolled and long product market indicators and finally of construction and manufacturing indicators. The indicators are classified as leading, coincident or lagging as indicated.
Columns in the chart are designed to differentiate between the current situation and the direction in which the market is headed. The present situation is sub-divided into, below the historical norm (-), (OK), and above the historical norm (+). The “Values” section of the chart is a quantitative definition of the market’s direction. In cases where seasonality is an issue, the evaluation of market direction is made on a three month moving average basis and compared year over year to eliminate this effect. Where seasonality is not an issue concurrent periods are compared. The date of the latest data is identified in the third values column. Values will always be current as of the date of publication. Finally the far right column quantifies the trend as a percentage or numerical change with color code classification to indicate positive or negative direction.


