

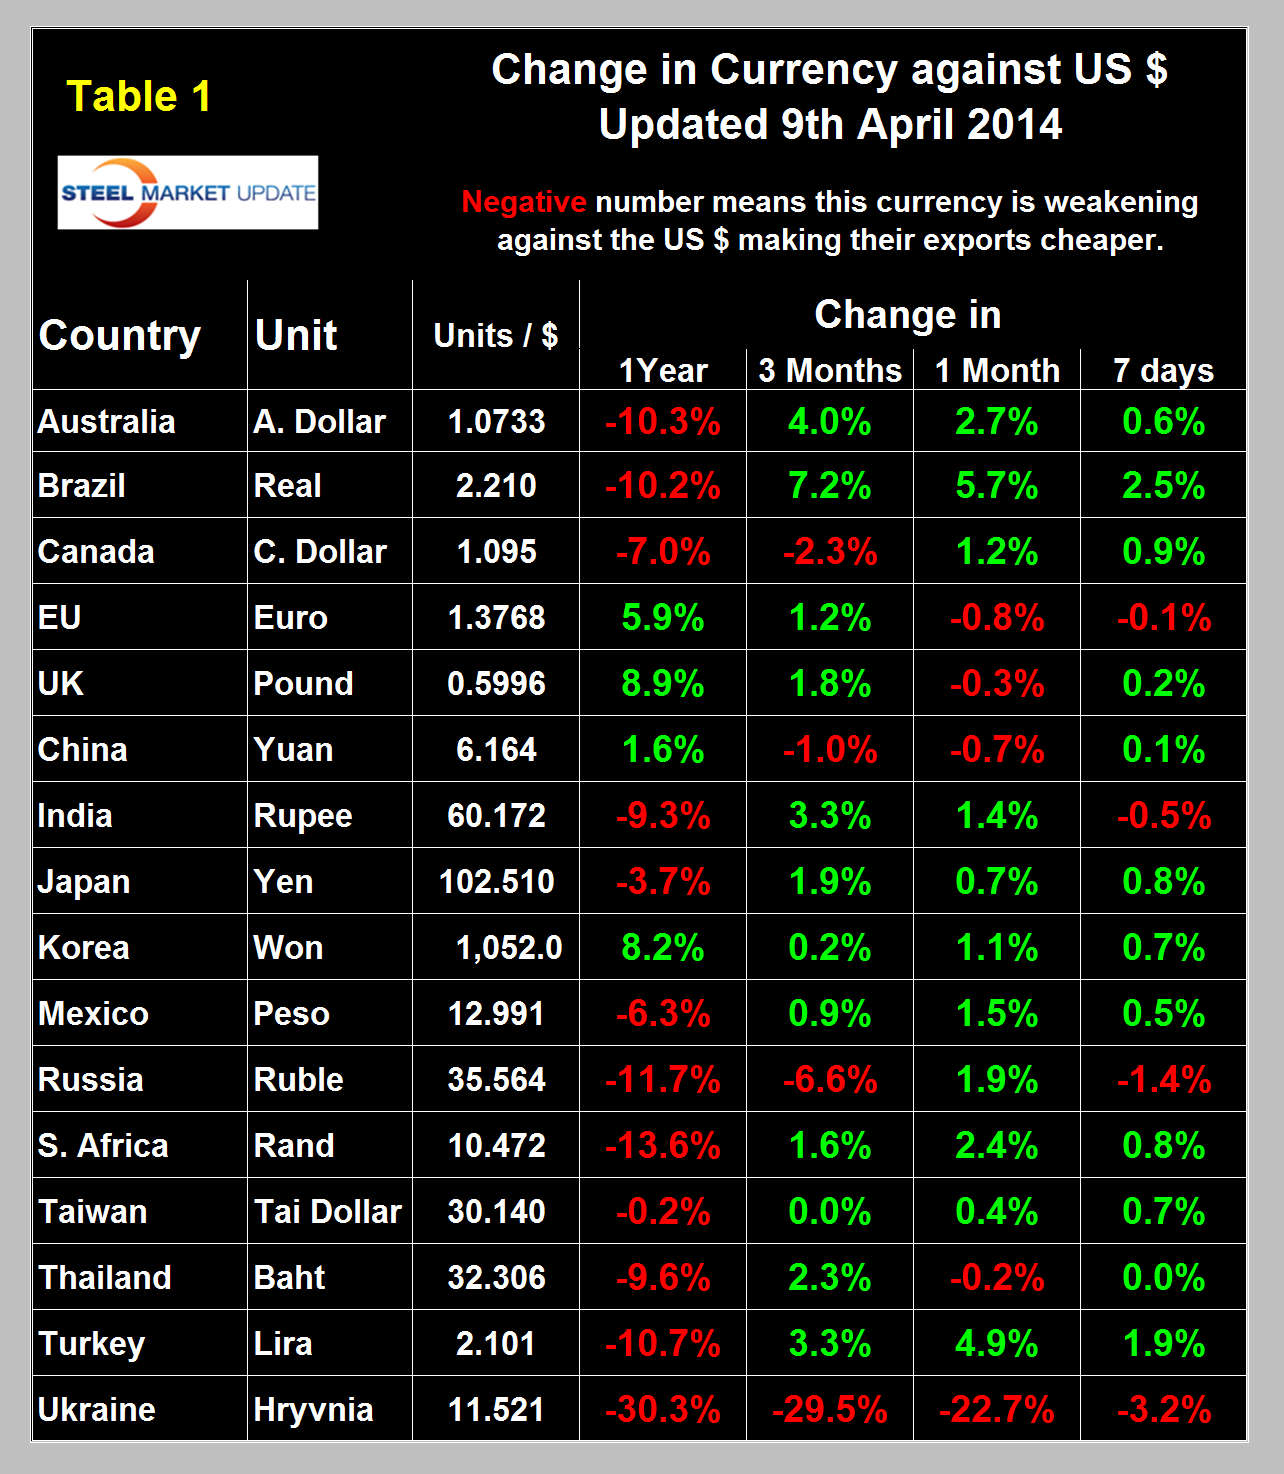
Market Data

April 14, 2014
Currency Update for Steel Trading Nations - April 2014
Written by Peter Wright
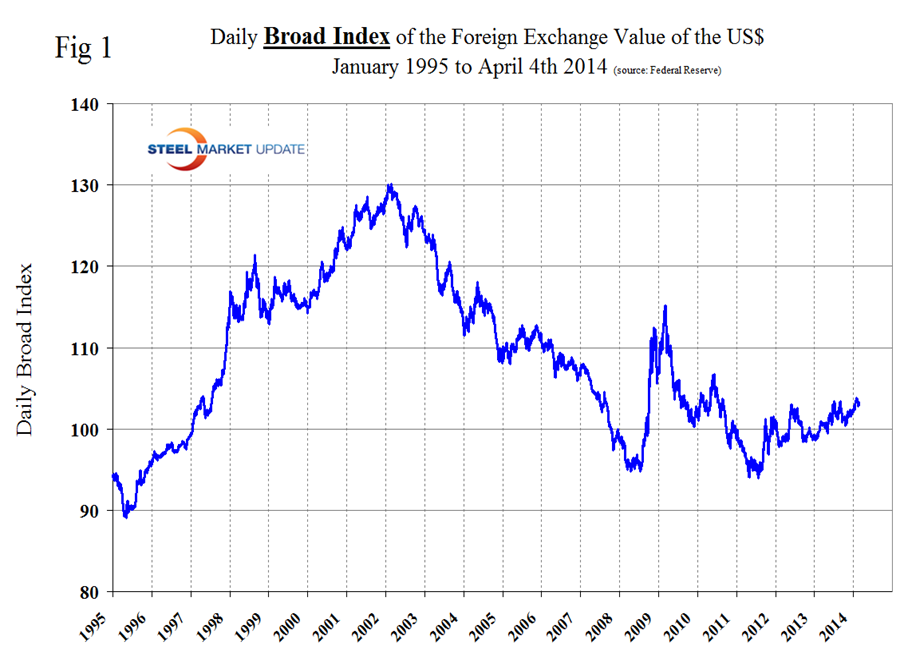
The Broad Index value of the US Dollar has been gradually increasing for 18 months (Figure 1) which tends of raise imports to the US and depress exports. The broad index is a weighted average of the foreign exchange values of the U.S. Dollar against the currencies of a large group of major U.S. trading partners. The index weights, which change over time, are derived from U.S. export shares and from U.S. and foreign import shares. The data are noon buying rates in New York for cable transfers payable in the listed currencies.
At SMU we use the historical exchange rates published in the Oanda Forex trading platform to track the currency value of the US Dollar against that of sixteen steel trading nations. Oanda operates within the guidelines of six major regulatory authorities around the world and provides access to over 70 currency pairs. Approximately $4 trillion US Dollars are traded every day on foreign exchange markets. Currencies of the steel trading nations as reported by Oanda do not necessarily track with the Federal Reserve Broad Index and in fact often move in the opposite direction. In the last three months the US Dollar has weakened against twelve of the currencies of the major sixteen steel trading nations. This trend continued in one month and in the last seven days. Table 1 shows the number of currency units that it takes to buy one US Dollar and the percent change in the last year, three months, one month and seven days.
In the last year the currencies of the major iron ore producing nations, Australia, Brazil and Canada have weakened against the US Dollar by 10.3 percent, 10.2 percent and 7.0 percent respectively. In the last month all three have shown some strengthening, particularly the Brazilian real which has risen by 5.7 percent in the last month. An increase in these currencies tends to inflate the global price of iron ore.
The Canadian Dollar and the Mexican Peso have strengthened by 1.2 percent and 1.5 percent respectively in the last month.
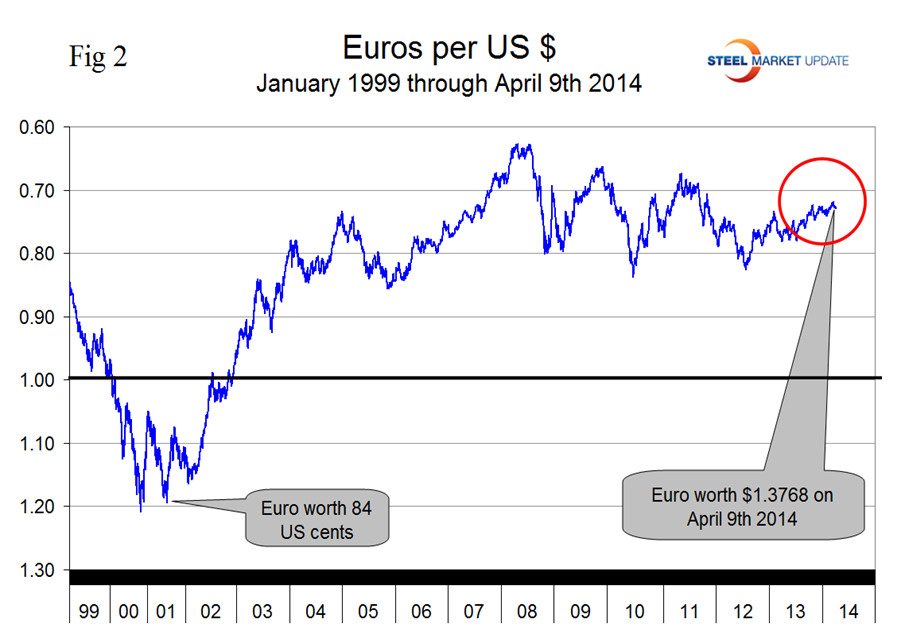
The Euro stood at 1.3768 US Dollars on April 9th (Figure 2) has strengthened steadily for over 18 months and is up by 5.9 percent in the last year.
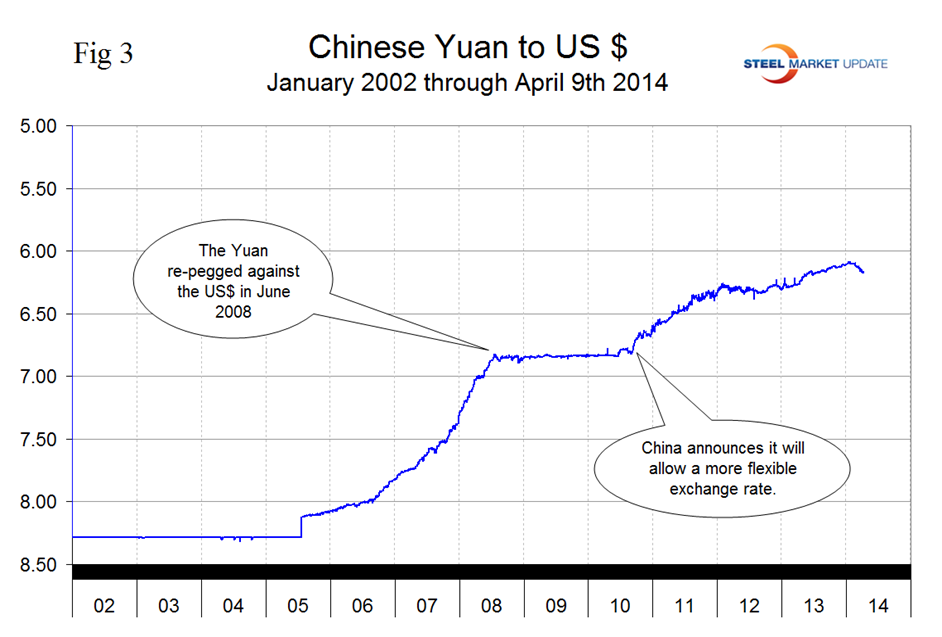
The Chinese Yuan has had the largest decline in the last three months since first allowed to appreciate in mid-2005 (Figure 3).
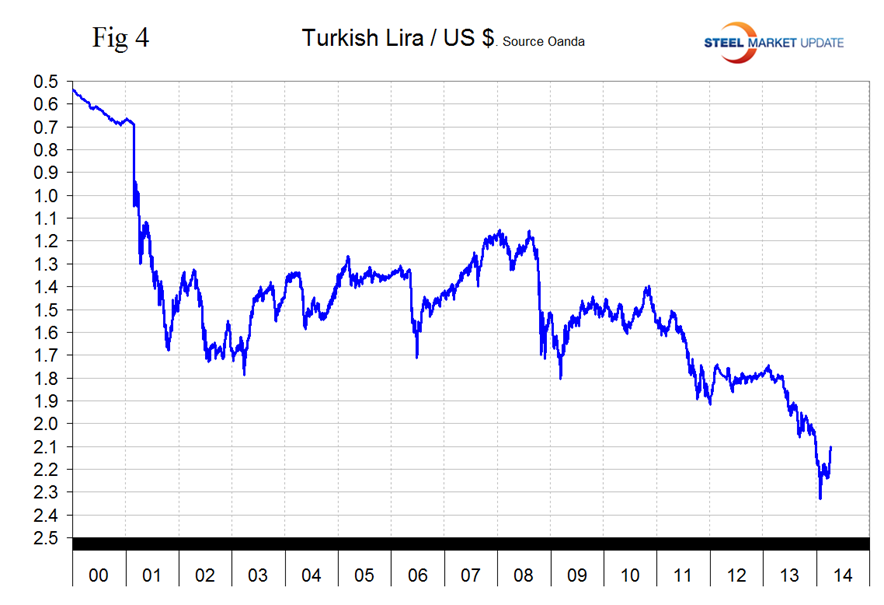
The Turkish Lira has recovered from its all-time low of 2.3299 / US Dollar on January 26th to 2.1011 on April 9th (Figure 4).
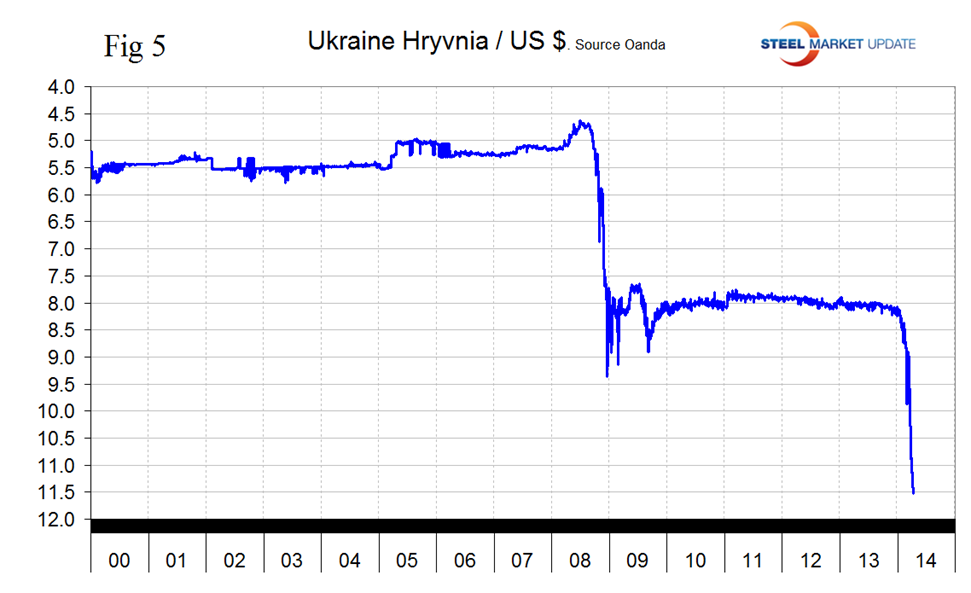
The Ukrainian Hryvnia is continuing its free fall, down by 22.7 percent in the last month and 3.2 percent in the last seven days (Figure 5).
On April 6th, the Wall Street Journal commented as follows: “Emerging market currencies rallied against the $ after the March employment report which was slightly worse than economists had expected reduced the chances that the Federal Reserve would accelerate its time table for cutting bond purchases and increasing interest rates. That eases the pressure on currencies, stocks and bonds in developing countries. Higher rates in the US would make yields in developing markets less attractive by comparison.


