Market Data
April 22, 2014
Chinese Economic Statistics in Q1 2014
Written by Peter Wright
Chinese statistical data is always questioned for a number of reasons, not least is, “Is the data politically motivated.” Other suspicions arise because China gets their data out faster than any other major economy and the data is never revised. However at SMU we believe that in spite of these concerns what we have is all there is and its importance is driven by the huge and excess steel capacity of China.
From what we understand the Chinese economy is becoming more consumer oriented and less dependent on fixed asset expenditures which are the largest consumer of steel products. If domestic Chinese steel demand declines will capacity be reduced or will companies increase exports to relieve the pressure. As we see it there are two underlying and conflicting motivators. These are the environment and employment. We have no idea which of these will prevail but what follows here is some macro-economic data that we track to try to get a view of the future.
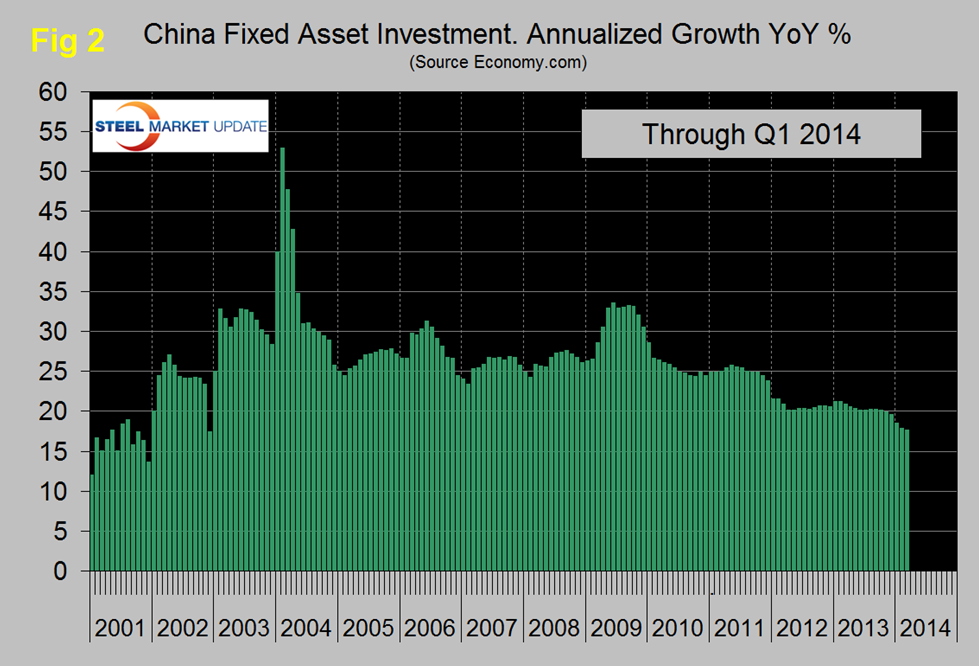
Figure 1 shows published data for the growth of GDP, industrial production and consumer prices through the first Q of 2014. The GDP and industrial production portions of this grapy are three month moving averages. GDP grew 7.4 percent y/y in the first quarter, the slowest pace since the third quarter of 2012 and below potential. This was the result of past monetary tightening, and a tough export environment. Stimulus measures introduced in July 2013 which included increased railway investment and tax incentives for exporters are having an impact, judging by the mild improvement in industrial production in March / February.
Industrial production grew 8.7 percent y/y in the first quarter, down 0.8 percentage point from the first quarter of 2013. Manufacturing output rose 9.9 percent, mining output rose 3.3 percent, steel production rose 5.3 percent y/y in March, cement production logged a 4 percent y/y increase, and crude oil output rose 2.4 percent y/y. Early April data suggest there is a seasonal improvement in the data. Steel inventories are declining and iron ore prices are recovering.
Consumer price inflation has been stable in the 2.0 percent to 3.0 percent range since May 2012.
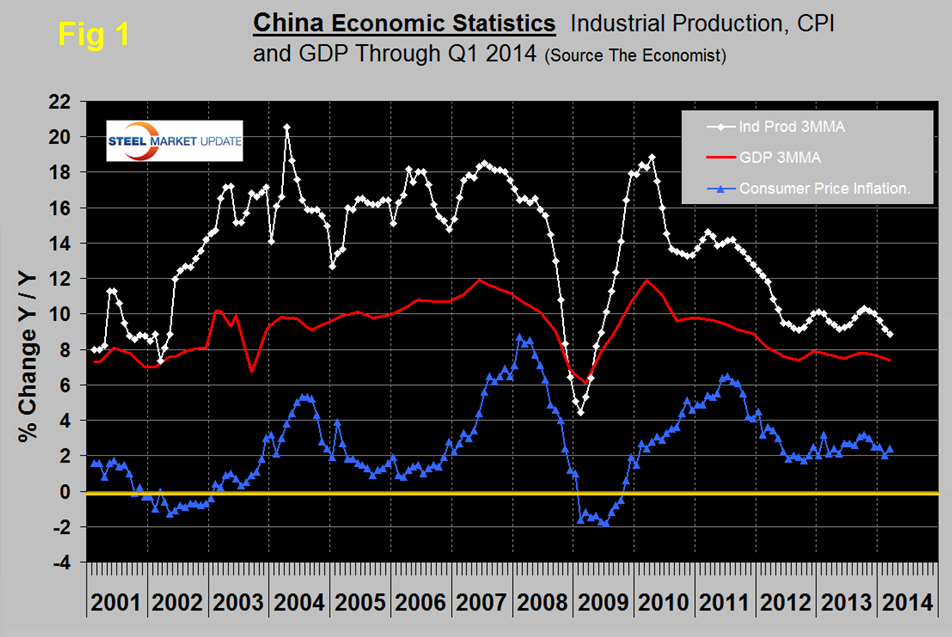
Figure 2 shows the growth of fixed asset investment y/y. The growth rate has been declining for over four years. We understand that the data includes real-estate purchases so is not a direct reflection of constructional steel demand. We are assuming that the steel on the ground portion of this data follows the overall trend and this is in line with the stated objective to rebalance the economy in favor of consumer consumption. By industry, investment in mining slowed to 12.1 percent in the year to March, up from the 10.2 percent in the year to February. Investment in oil and gas expanded 18.7 percent, capital spending on ferrous metals rose 17.1 percent, and investment in non-ferrous metals rose 0.3 percent. Moody’s Economy.com reported as follows. “Tight lending standards, uncertainty over the shadow banking sector and tight property restrictions will constrain investment over the coming quarters. We expect growth in nominal fixed investment will ease toward 15 percent by the end of 2014. However, the government’s mini-stimulus and attempts to restart rail investment will add some upside, while strengthening global demand should lift investment in export-facing industries.”