

Market Data

May 11, 2014
SMU Survey: Demand Growth Picking Up Steam
Written by John Packard
For the first time since Steel Market Update began surveying the flat rolled steel industry, a majority of our respondents are reporting demand as “improving.” As you can see by the timeline shown in the graphic below, the optimistic trend for demand growth began to pick up steam during late 1st Quarter 2014 and momentum has been building ever since. In the most recent survey, which was conducted this past week, 52 percent of all steel buyers and sellers of flat rolled steel responding reported demand as improving.
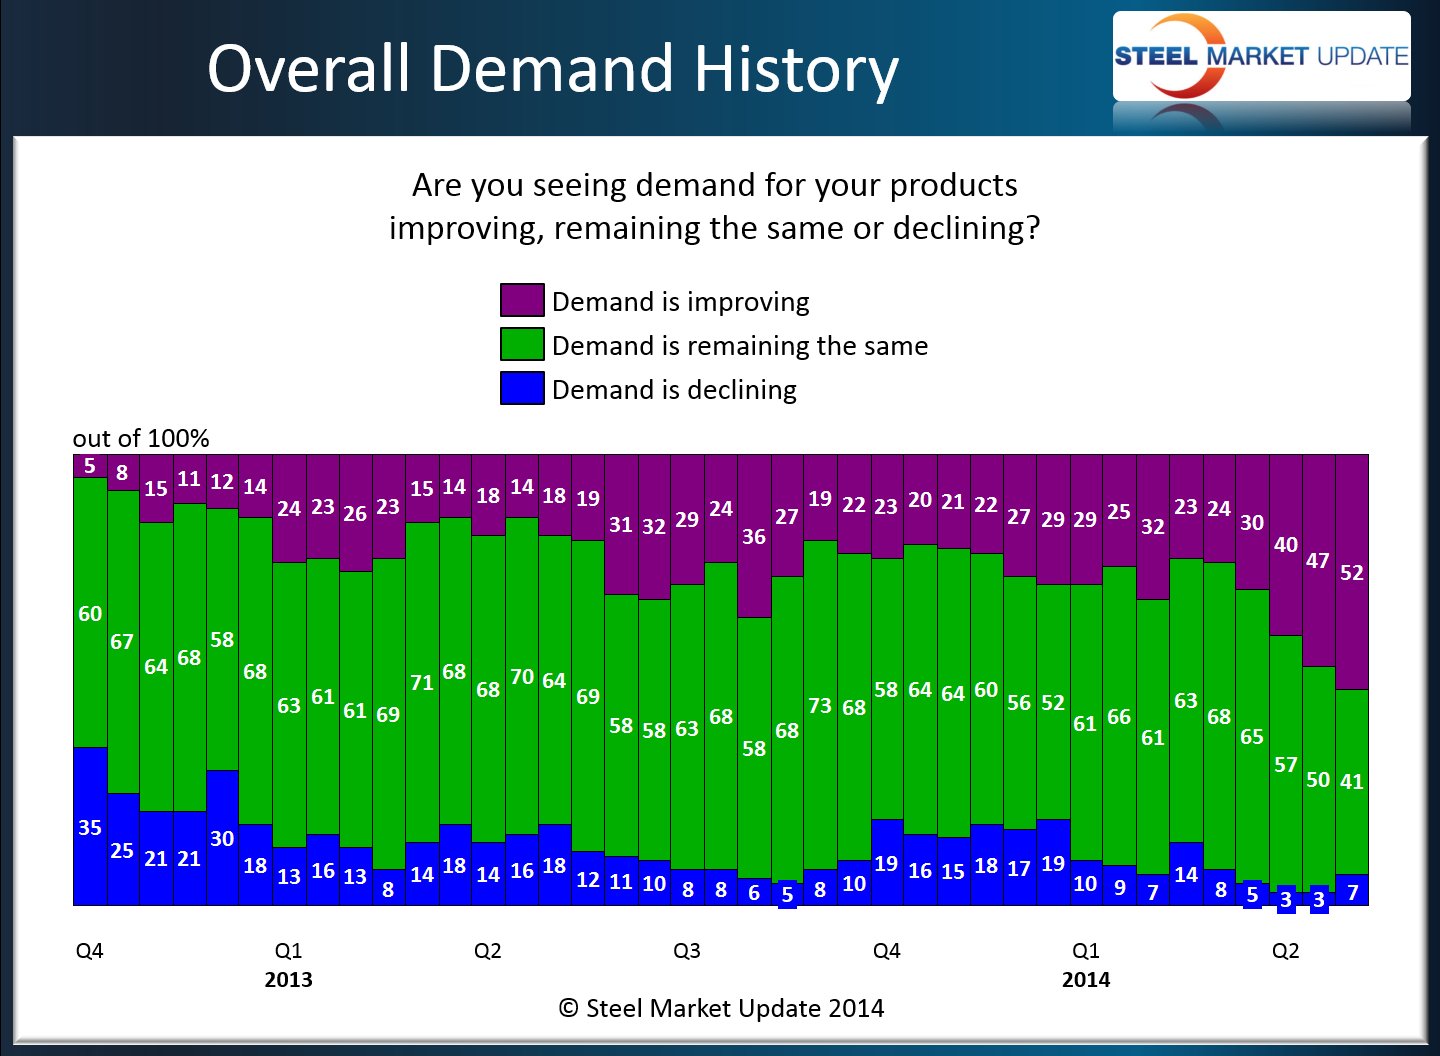
During the questionnaire process we split respondents into their appropriate market segment and then check to see if our overall demand results are limited to one particular segment (manufacturing or distribution). In last week’s survey we found 53 percent of service centers reporting that their end user customers are releasing more steel this year compared to last year at this time.
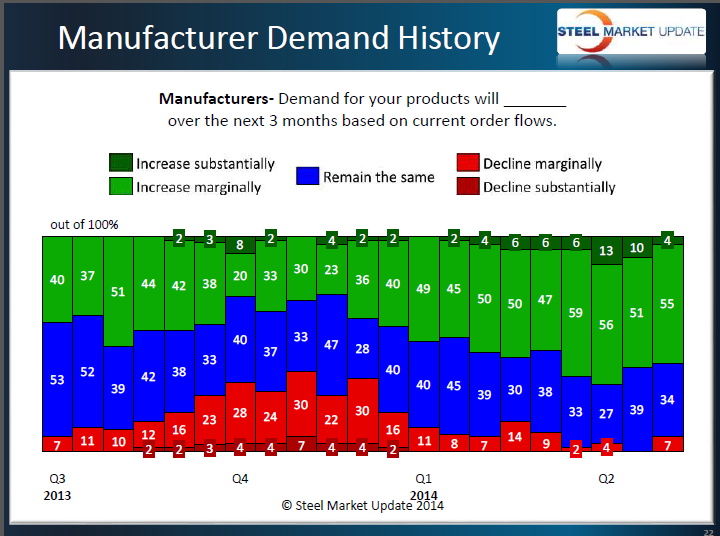
Manufacturing companies have been reporting better demand on their products for a number of months going tack to February 2014. Manufacturers reported demand as increasing marginally (55 percent) or increasing substantially (4 percent) while only 34 percent reported demand as remaining the same and 7 percent told SMU during the survey process that demand would declining marginally on their products over the next 3 months.
Below is a longer term view of manufacturing demand responses.
The graphics shown are part of a much larger Power Point presentation which is provided to our Premium Level members and is available to them on our website.


