Market Segment
May 21, 2014
Service Center Intake, Shipments and Inventory in April 2014
Written by Peter Wright
Total service center carbon steel shipments in April rose by 125,500 tons to 3.640 million tons, the highest monthly tonnage since March two years ago. Shipping days in April were unchanged from March at 21. Tons per day (t/d) shipments rose from 167,400 March to 173,300 in April, both on a non-seasonally adjusted basis. Intake in April was 190,000 t/d leading to a daily surplus of 16,700 tons. Months on hand rose from 2.22 to 2.24.
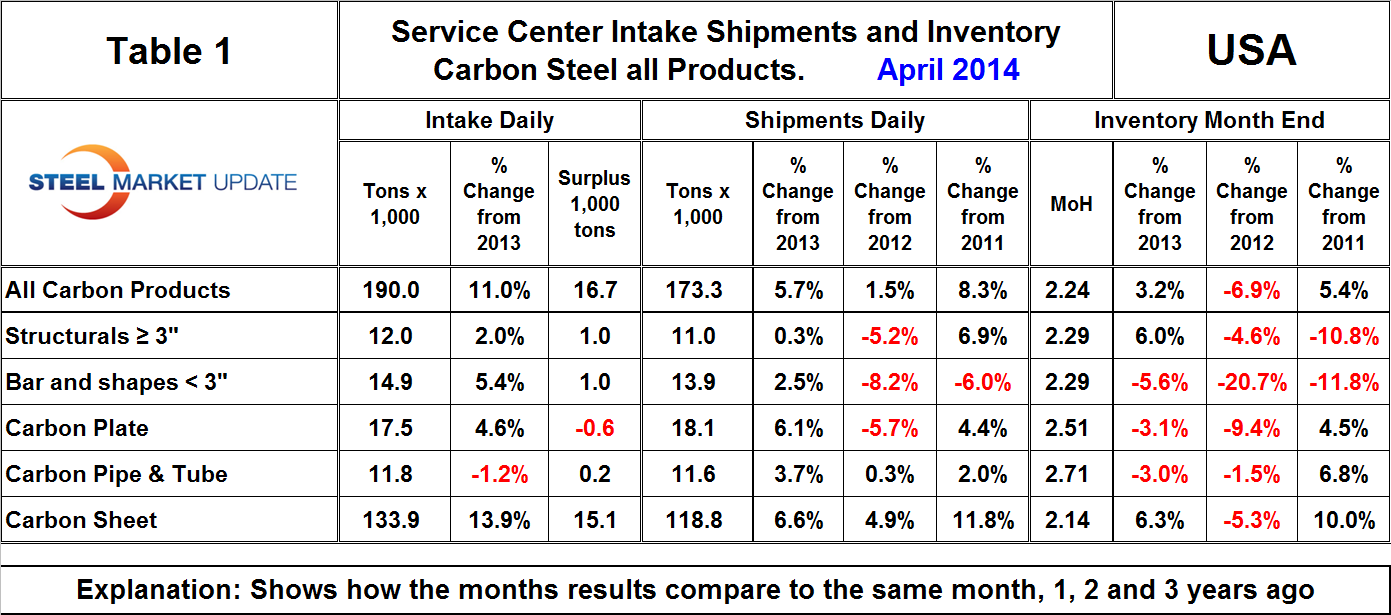
Table 1 shows the performance by product in April compared to the same month in previous years. Shipments of all products on a t/d basis were up by 5.7 percent from April last year and long products, particularly structurals, continued to lag flat rolled and tubulars. Sheet products were up by 6.6 percent and plate by 6.1 percent. In April there was a surge in the intake of sheet products which with a surplus of 15,100 tons accounted for almost all of the carbon product excess of intake over shipments. All other products except plate had a small surplus intake. Compared to the end of April last year, month end inventories were up by 3.2 percent in total, however, structurals and sheet accounted for all the increase. Bars, plate and tubulars experienced a decrease in months on hand at the end of April.
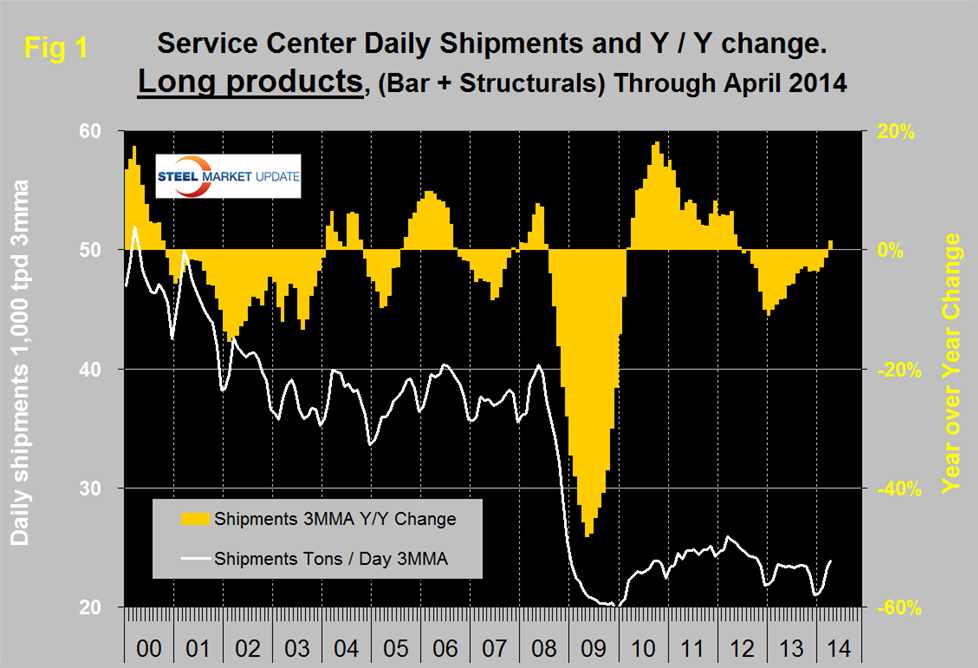
There is a wide difference between the performance of flat rolled, (sheet + plate) and long products, (structurals + bar) at the service center level. Long products have had a very poor recovery from the recession and on a 3MMA basis y/y, April was the first month of positive growth after 21 straight months of decline, (Figure 1).
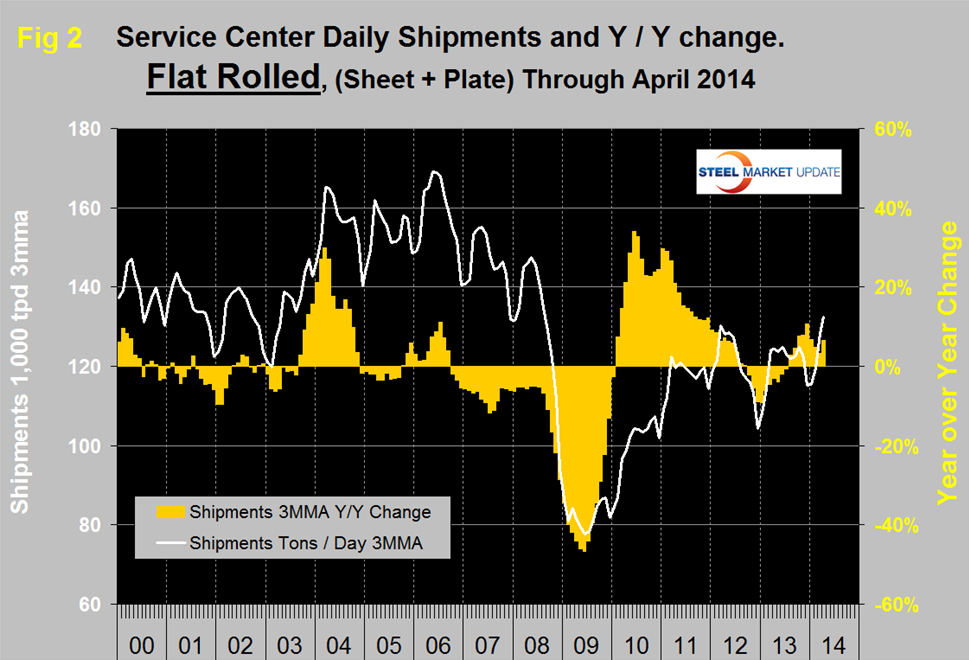
Flat rolled has had a much better recovery since mid-2009 and has had positive y/y growth in each of the last nine months, (Figure 2).
In 2006 and 2007, the good old days, the mills and service centers were operating at maximum capacity. Figure 3 takes the shipments by product since that time frame and indexes them to the average for 2006 and 2007 in order to measure the extent to which each product’s shipments from service centers has recovered.
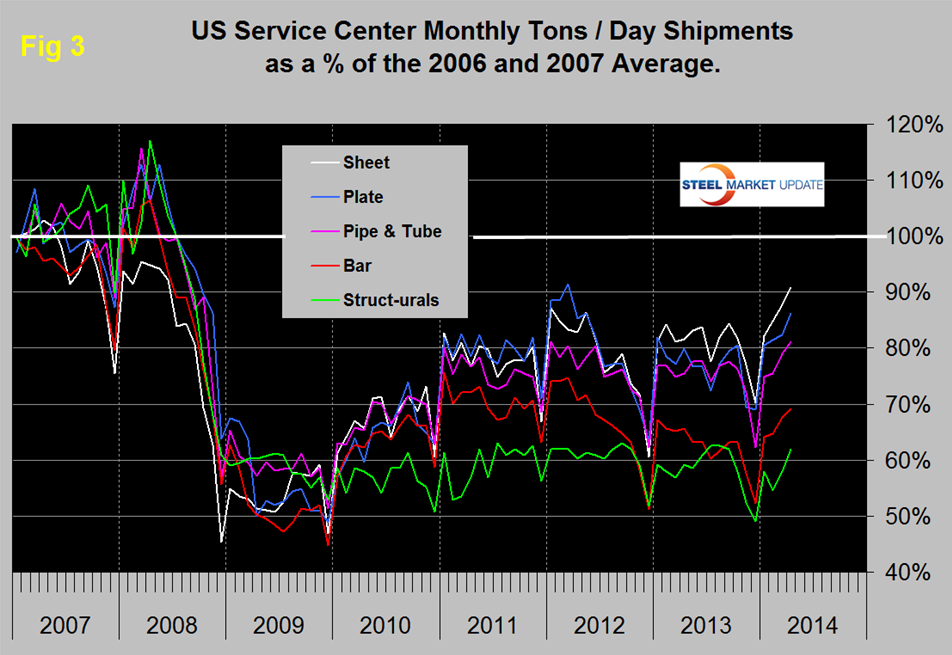
Again, it can be seen that sheet and plate have fared best, bar and structurals the worst and tubulars in between. Sheet has had the best recovery and in April exceeded 90 percent of the 2006 / 2007 average for the first time since the recession. Structurals are still only at 62.0 percent of where they were. The total of all carbon products is still only at 81.6 percent of the 2006 / 2007 average, and, therefore, is down by 18.4 percent. The recovery of the service center sector has been much slower than has been experienced by the mills. Presumably this is because in a relatively lack luster market, more buyers are by-passing service centers and buying mill direct and this is probably particularly true of long products. In addition, long products being more construction oriented are suffering from prevailing conditions in that business sector.
MSCI uses product nomenclature flat and plate. In our analysis at SMU we replace the term flat with sheet. By our interpretation of the MSCI’s data, our definition of sheet is all hot rolled, cold rolled and coated products. Since most of our readers are sheet oriented we have removed plate from Figure 3 to highlight the history of sheet products, (Figure 4). Positive year over year growth has occurred in each of the last ten months following nine consecutive months of decline.
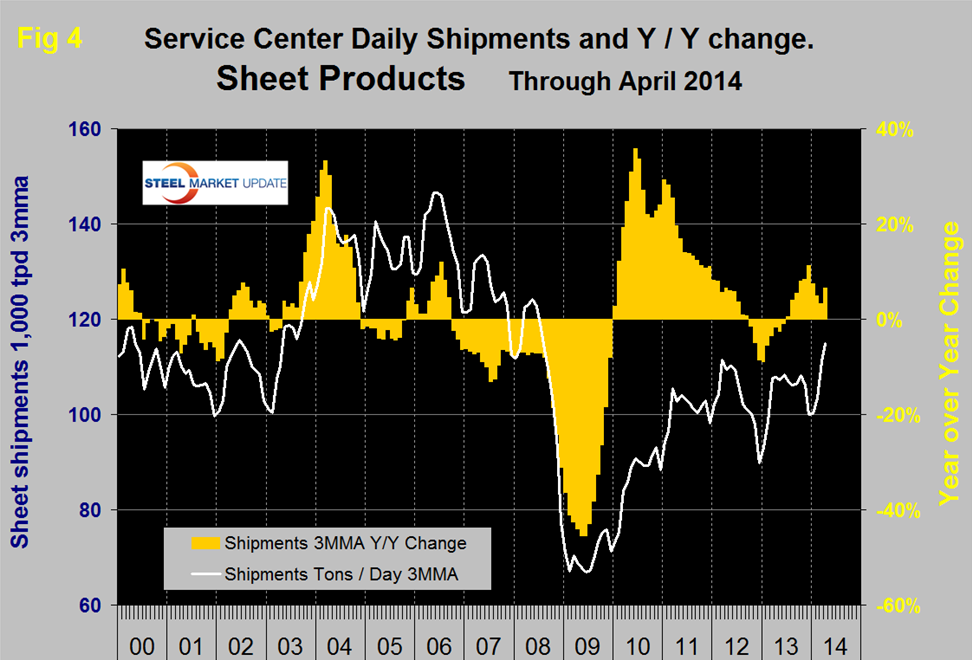
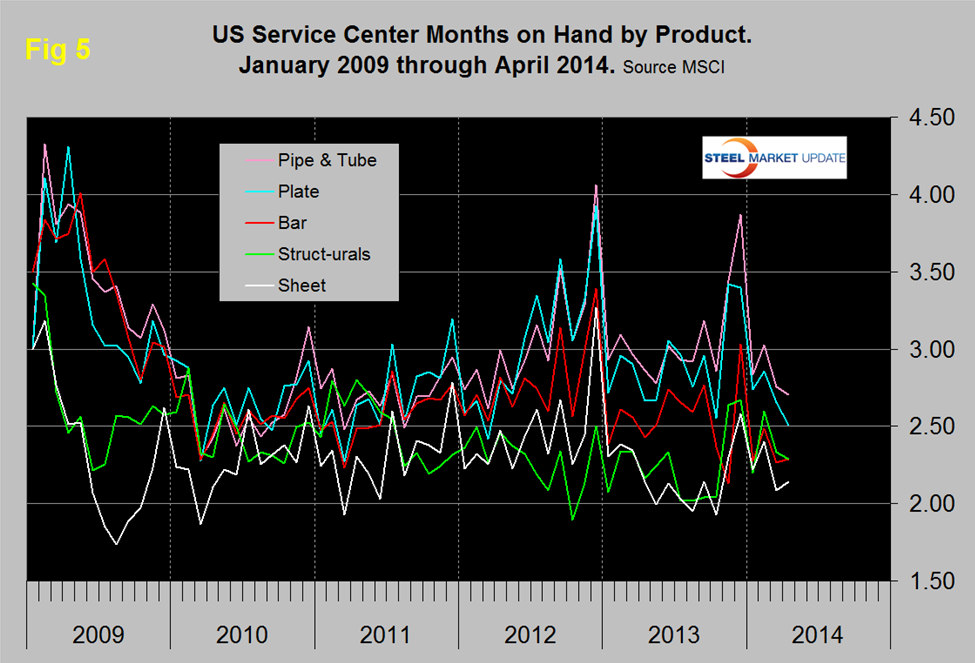
Figure 5 shows the change of inventory at service centers since 2009 measured as months on hand. All products except bar and sheet experienced a decline in months on hand at the end of April. Sheet products constitute by far the largest segment of service center’s business and they have had the best inventory management since 2009 and currently have the lowest months on hand.