

Market Data
June 25, 2014
Producer Price Indexes of Sheet Steel, Aluminum, Plastic and Transportation in May 2014
Written by Peter Wright
Each month the Bureau of Labor Statistics, (BLS) puts out its series of producer price indexes, for thousands of goods and materials. The latest release on Friday reported May results. These statistics are a useful way to evaluate any changes in the competitive position of steel against competing materials and this month for the first time we have included truck and rail transportation. See below for the official description of this program. The May report from the BLS began as follows; The Producer Price Index for final demand fell 0.2 percent in May, seasonally adjusted, the U.S. Bureau of Labor Statistics reported today. This decline followed increases of 0.6 percent in April and 0.5 percent in March. The decline in final demand prices can be traced to the indexes for final demand services and final demand goods, both of which declined 0.2 percent. Within intermediate demand, prices for processed goods edged down 0.1 percent, the index for unprocessed goods was unchanged, and prices for services fell 0.4 percent.
For the purpose of this report, SMU has extracted comparative statistics for sheet steel, aluminum and plastic products and truck and rail transportation. Table 1 is a summary of each category on a year over one, two and three year basis. One cell in this table for plastic water pipe contains the code n/a because this data series is too new to make a 36 month comparison.
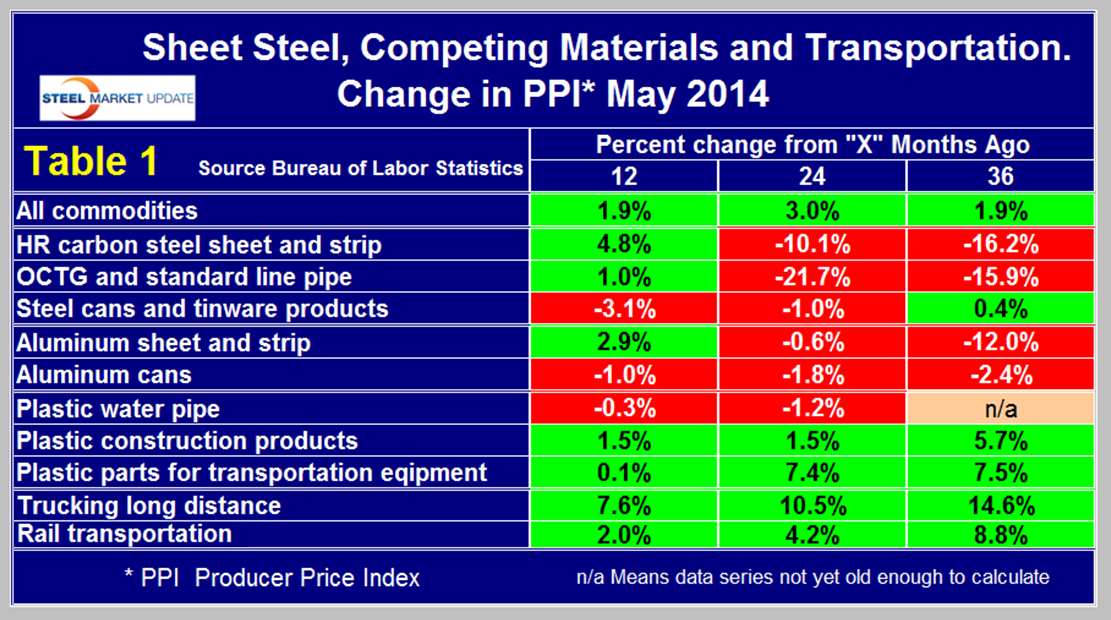
What the PPI data shows is that the acceleration in commodity prices slowed to 1.9 percent in 12months through May from 3.0 percent in 24 months through May. Both hot rolled carbon sheet and strip and OCTG reversed course in a positive direction in May. The price of steel cans and tin-ware products made some competitive progress against aluminum cans in the last 12 months after years of declining competitiveness. Steel has become more competitive against plastic piping, construction products and construction equipment parts in the last 24 and 36 months.
The PPI data are helpful in monitoring the competitive price of steel and steel products against competing materials and products. As far as we at SMU can tell from comparison with known transaction prices, these PPI are a good representation of the real world.
Table 1 also shows price changes for truck and rail transportation and indicates that highway delivery has lost ground to rail in the last 12, 24 and 36 month periods. See below for more detail from Arvada.
The next two paragraphs are extracted from Friday’s BLS report. The explanation of “Stage of intermediate demand is given at the end of this report.” Stages 1 and 2 are relevant to steel producers and processors.
Prices for stage 1 intermediate demand fell 0.6 percent in May, the third consecutive decrease. The indexes for total goods inputs to stage 1 intermediate demand and for total services inputs both moved down 0.6 percent in May. Declines in the indexes for basic organic chemicals; carbon steel scrap; plastic products wholesaling; and gasoline outweighed increases in the indexes for diesel fuel, fuels and lubricants retailing, and copper base scrap. For the 12 months ended in May, prices for stage 1 intermediate demand rose 1.6 percent.
Prices for stage 2 intermediate demand rose 0.3 percent in May subsequent to declines in the priortwo months. In May, the index for total goods inputs to stage 2 intermediate demand advanced 1.0percent, and prices for total services inputs moved down 0.4 percent. Higher prices for crude petroleum,natural gas, legal services, formula feeds, fuels and lubricants retailing, and diesel fuel outweigheddeclines in the indexes for business loans (partial); basic organic chemicals; and metals, minerals, andores wholesaling. For the 12 months ended in May, prices for stage 2 intermediate demand increased 1.6percent.
Moody’s Economy.com commented as follows on the May PPI report; the outlook for a sustained pickup in commodity prices and U.S. core inflation is still facing challenges. Producer prices took a step back in May after rallying for two months. Petroleum prices rose, but most finished goods, intermediate materials, and services prices were weak. The reason to still be bullish on commodity prices is that the recovery overseas is strengthening. Fiscal uncertainty is receding in developed countries, and developing economies appear better-prepared for the reduction in liquidity as the Federal Reserve ends asset purchases. Increasing trade in capital equipment is especially encouraging, and the coming wave of business investment will have multiplier benefits throughout the world economy. This will boost input prices globally and allow U.S. inflation to further strengthen toward normality. Core inflation should pick up even without much pass-through via energy prices. Crude oil prices have traded in a fairly narrow range for months considering the still-tense situation in Ukraine and other geopolitical concerns, and the rally in gasoline prices appears to be flagging. U.S. crude oil inventories are falling but remain high, as rising domestic production has made up for reduced inflows of imported crude, limiting price gains. Fuel prices should remain calm even with signs of stronger energy demand in developing countries. However, the recent wave of violence in Iraq threatens to cause disorderly spikes in crude oil prices, especially as the fighting spreads south toward the country’s oilfields.
From Armada Executive Intelligence Brief: Trucking Prices Shoot Up. If we take a look at the Producer Price Index for trucking, we see that LTL hit another all-time high in May. The index for full truckload quantities came in at 147.7, another all-time high. This is probably coming as no surprise to most of you who ship products – you have probably seen it hard to find capacity – or when you do find it, it has become pretty expensive. The biggest driver of this increase in the PPI comes from truck driver shortages that have hit the sector. Bloomberg Intelligence reported that the country is currently short approximately 256,000 drivers. We see that shortage in the respective Producer Price Indexes. If we now get a significant increase in diesel prices (the price per gallon for diesel is made up of 68 percent crude oil prices), the added fuel surcharges will put significant pressure back on supply chain managers. Problems in Vietnam and China, challenges with carrier capacity shortages, possible work stoppage on the West Coast, and a host of other potential concerns are looming.
Rail Prices Also Surge to New Highs. We wanted to pull the rail PPI out separately. Under the Bureau of Labor Statistics view of producer prices, we can get a reading of line-haul rail in both carload and intermodal sectors. The first reading we’ll cover is the carload segment. Carload rail shipping has hit an all-time high at 193.4 points in May. That was up by approximately .5 points from levels in March, a fairly significant jump in prices month to- month. Intermodal was also hitting new all-time highs in May, coming in at 163.9, up .6 points from levels in March.
Many analysts are watching the situation on the US West Coast very carefully to determine whether there will be a work stoppage by the ILWU (International Longshore and Warehouse Union). This union controls the 20,000+ workers that keep the West Coast ports flowing. Their current 7 year contract is up on June 30th and labor negotiations have been fairly quiet. This does not mean that there will be a work stoppage, but the heated part of the debate will start within the next couple of weeks. Supply chain managers are already diverting freight, and with an average transit time of about 18 days from Asia to the US, supply chain managers would be making their decisions now as to whether they are going to delay, divert, or inbound merchandise prior to June 30th.
The official description from the Bureau of Labor Statistics, (BLS) reads as follows. The Producer Price Index (PPI) is a family of indexes that measure the average change over time in the prices received by domestic producers of goods and services. PPIs measure price change from the perspective of the seller. This contrasts with other measures, such as the Consumer Price Index (CPI). CPIs measure price change from the purchaser’s perspective. Sellers’ and purchasers’ prices can differ due to government subsidies, sales and excise taxes, and distribution costs. More than 9,000 PPIs for individual products and groups of products are released each month. PPIs are available for the products of virtually every industry in the mining and manufacturing sectors of the U.S. economy. New PPIs are gradually being introduced for the products of industries in the construction, trade, finance, and services sectors of the economy. More than 100,000 price quotations per month are organized into three sets of PPIs: (1) Stage-of-processing indexes, (2) commodity indexes, and (3) indexes for the net output of industries and their products. The stage-of processing structure organizes products by class of buyer and degree of fabrication. The commodity structure organizes products by similarity of end use or material composition. The entire output of various industries is sampled to derive price indexes for the net output of industries and their products.
Stage-of-Processing Indexes: Within the stage-of-processing system, finished goods are commodities that will not undergo further processing and are ready for sale to the final-demand user, either an individual consumer or business firm. Finished consumer goods include durable goods such as automobiles, household furniture, and appliances, as well as nondurable goods such as apparel and home heating oil. Capital equipment includes durable goods such as heavy motor trucks, tractors, and machine tools.
The stage-of-processing category for intermediate materials, supplies, and components consists partly of commodities that have been processed but require further processing. Examples of such semi-finished goods include flour, cotton yarn, steel mill products, and lumber. The intermediate goods category also encompasses nondurable, physically complete items purchased by business firms as inputs for their operations. Examples include diesel fuel, belts and belting, paper boxes, and fertilizers.
Crude materials for further processing are products entering the market for the first time that have not been manufactured or fabricated and that are not sold directly to consumers. Crude foodstuffs and feedstuffs include items such as grains and livestock. Examples of crude nonfood materials include raw cotton, crude petroleum, coal, hides and skins, and iron and steel scrap.


