Market Segment
July 17, 2014
Service Center Intake, Shipments and Inventory in June 2014
Written by Peter Wright
Total service center carbon steel shipments in June declined by 56,500 tons to 3.527 million tons. This was almost exactly the same decline as experienced in May and which together almost wiped out the April gain. Shipping days were 21 in June, the same as in April and May. April was the highest monthly shipping month since March two years ago. Tons per day (t/d) shipments declined from 170,600 in May to 168,600 in June, both on a non-seasonally adjusted basis. Table 1 shows the performance by product in June compared to the same month in previous years.
![]() This month we have modified Table 1 to try to present a clearer picture of service center activity. It seems to us as we work with many data sources that a completely different picture can be presented depending on how the numbers are sliced and diced. MSCI data certainly falls into this category. Comparing a month’s performance with the previous month is frequently misleading because of seasonal effects. In past versions of Table 1 we compared a single month’s performance with the same month, one, two and three years ago which we have decided was overly cumbersome. In this latest revision we have compared June shipments on a t/d basis with the average t/d for June 2014, June 2013 and June 2012. We then calculate the percent change between June 2014 and June 2013 and with the 3 year June average. We hope this give the best possible view of market direction. Shipments of all products on a t/d basis were up by 4.7 from June last year and up by 3.2 percent from the average June shipments for 2014, 2013 and 2012. The fact that the single month comparison has a greater improvement than the three year comparison leads us to the conclusion that the improvement is accelerating. This is particularly true of plate. Structurals were the only product that slowed on this basis. Sheet products were up by 4.9 percent year over year and by 4.1 percent in the three year comparison.
This month we have modified Table 1 to try to present a clearer picture of service center activity. It seems to us as we work with many data sources that a completely different picture can be presented depending on how the numbers are sliced and diced. MSCI data certainly falls into this category. Comparing a month’s performance with the previous month is frequently misleading because of seasonal effects. In past versions of Table 1 we compared a single month’s performance with the same month, one, two and three years ago which we have decided was overly cumbersome. In this latest revision we have compared June shipments on a t/d basis with the average t/d for June 2014, June 2013 and June 2012. We then calculate the percent change between June 2014 and June 2013 and with the 3 year June average. We hope this give the best possible view of market direction. Shipments of all products on a t/d basis were up by 4.7 from June last year and up by 3.2 percent from the average June shipments for 2014, 2013 and 2012. The fact that the single month comparison has a greater improvement than the three year comparison leads us to the conclusion that the improvement is accelerating. This is particularly true of plate. Structurals were the only product that slowed on this basis. Sheet products were up by 4.9 percent year over year and by 4.1 percent in the three year comparison.
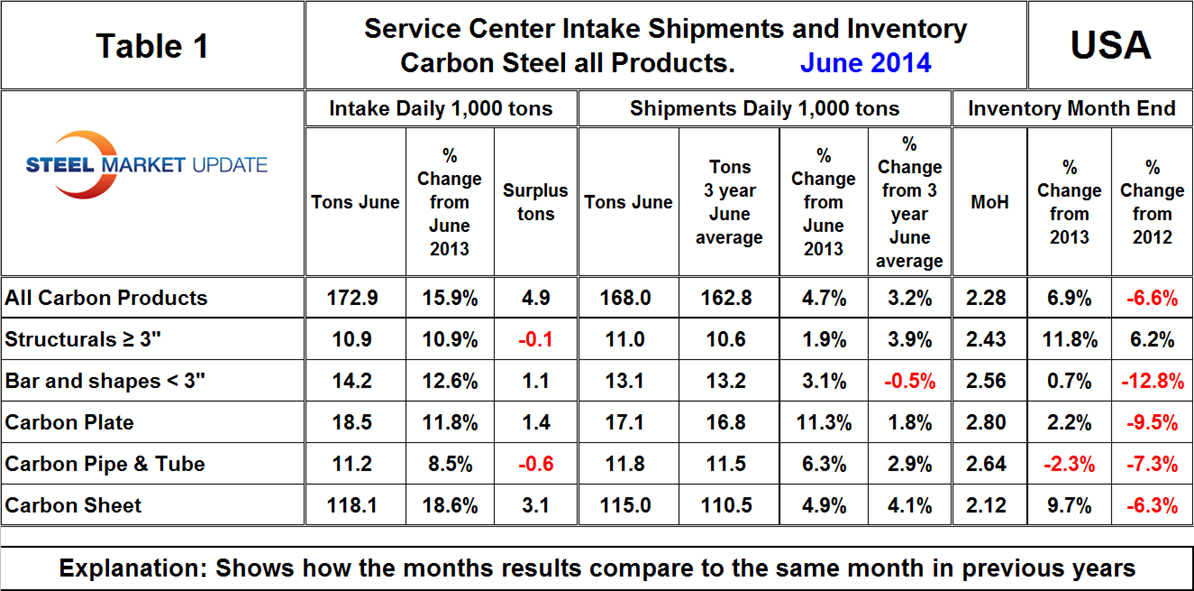
June intake increased by 252,900 tons which calculates to 8,100 t/d. This led to an intake surplus of 4,900 t/d. Months on hand (MoH) increased from 2.22 at the end of May to 2.28 at the end of June. All products except structurals and pipe and tube had a surplus of intake.
Compared to the end of June last year, moth end inventories were up by 6.9 percent in total, with structurals once again leading with an 11.8 percent increase. There has been quite a bit of optimism recently about the prospects for nonresidential construction and service centers seem to be responding accordingly. Sheet product inventories were up by 9.7 percent year over year but MoH only reached 2.12 at month end.
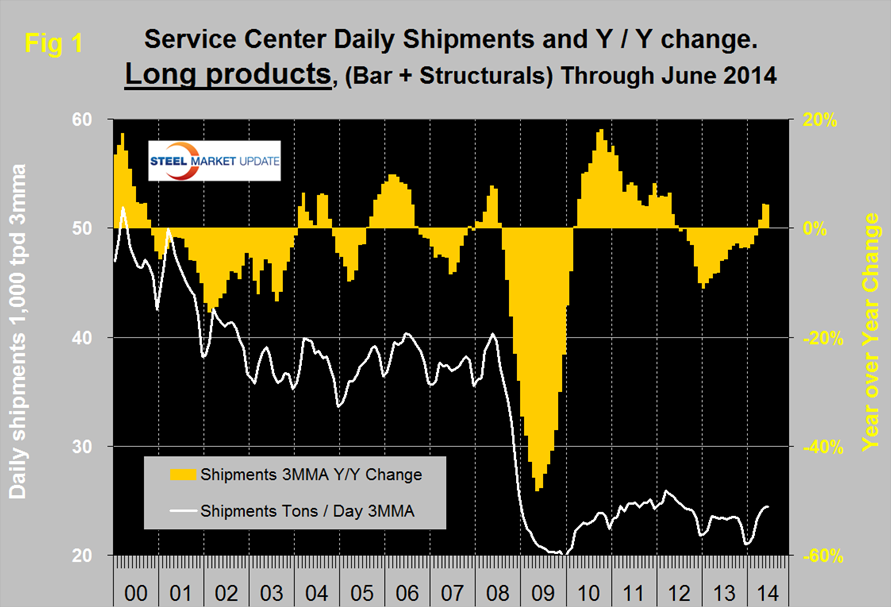
There continues to be a wide difference between the performances of flat rolled (sheet + plate) and long products, (structurals + bar) at the service center level. Long products have had a very poor recovery from the recession and on a 3MMA basis y/y, April, May and June were the first months of positive year/year growth after 21 straight months of decline, (Figure 1).
Flat rolled has had a much better recovery since mid-2009 and has had positive y/y growth in each of the last eleven months, (Figure 2). In 2006 and 2007, the mills and service centers were operating at maximum capacity.
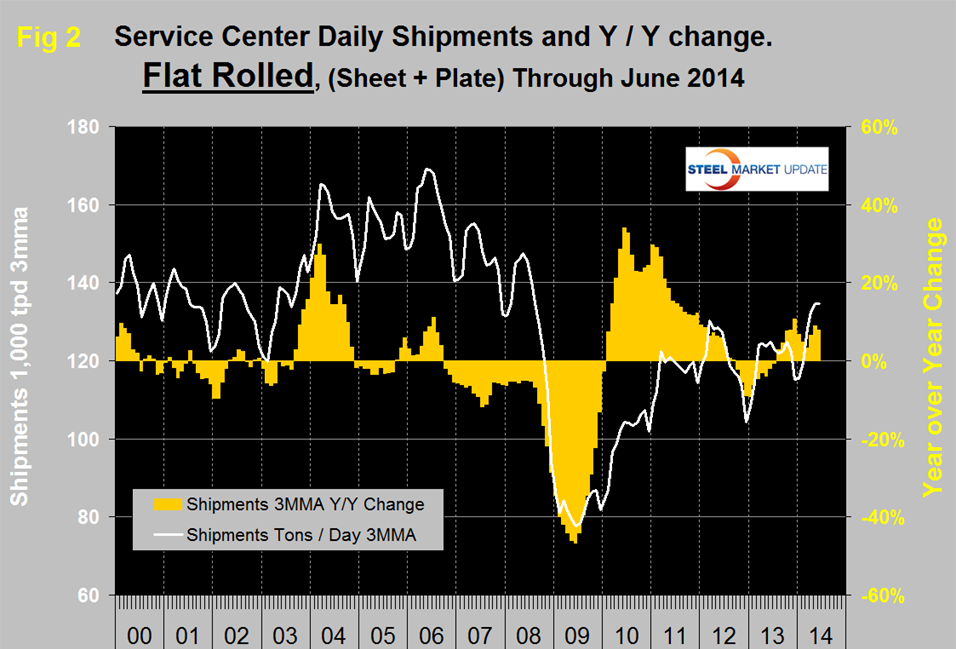
Figure 3 takes the shipments by product since that time frame and indexes them to the average for 2006 and 2007 in order to measure the extent to which service center shipments of each product have recovered. Again, it can be seen that bar and structurals have the worst record. Sheet has had the best recovery and in June plate and tubulars were about the same. Structurals are still only at 62.0 percent of where they were, sheet products are at 87.9 percent and the total of all carbon products is still only at 79.1 percent of the 2006 / 2007 average therefore is down by 20.9 percent. The recovery of the service center sector has been much slower than has been experienced by the mills. Presumably, this is because in a relatively lack luster market, more buyers are buying mill direct and this is probably particularly true of long products. In addition, long products being more construction oriented are suffering from the slow recovery of that business sector.
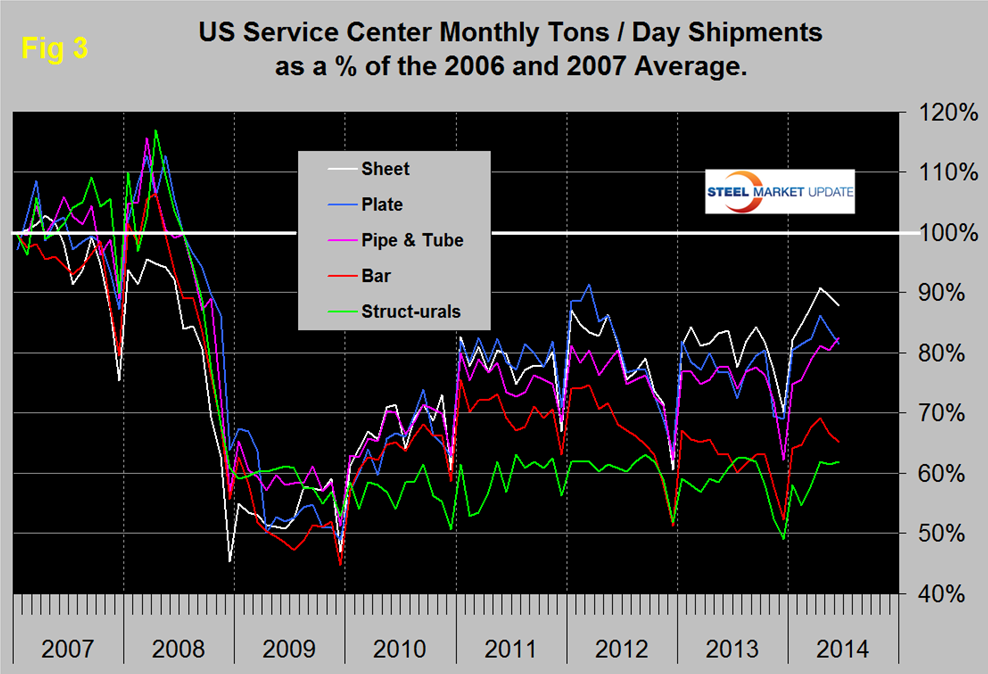
MSCI uses product nomenclature flat and plate. In our analysis at SMU we replace the term flat with sheet. By our interpretation of the MSCI’s data, their definition of sheet is all hot rolled, cold rolled and coated products. Since most of our readers are sheet oriented we have removed plate from Figure 3 to highlight the history of sheet products which are shown in (Figure 4). Positive year over year growth has occurred in each of the last twelve months following nine consecutive months of decline.
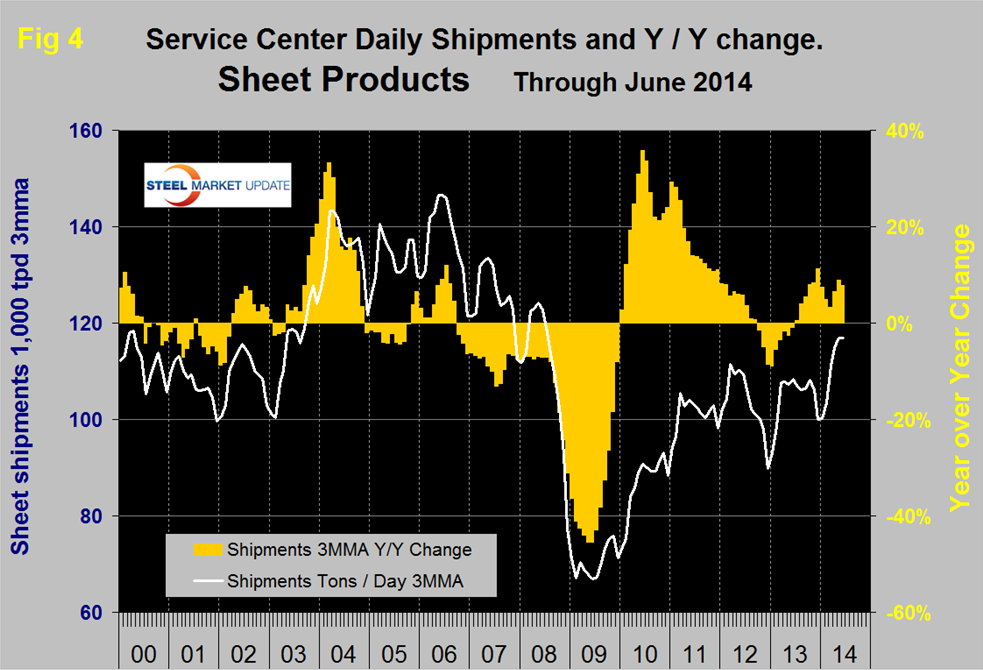
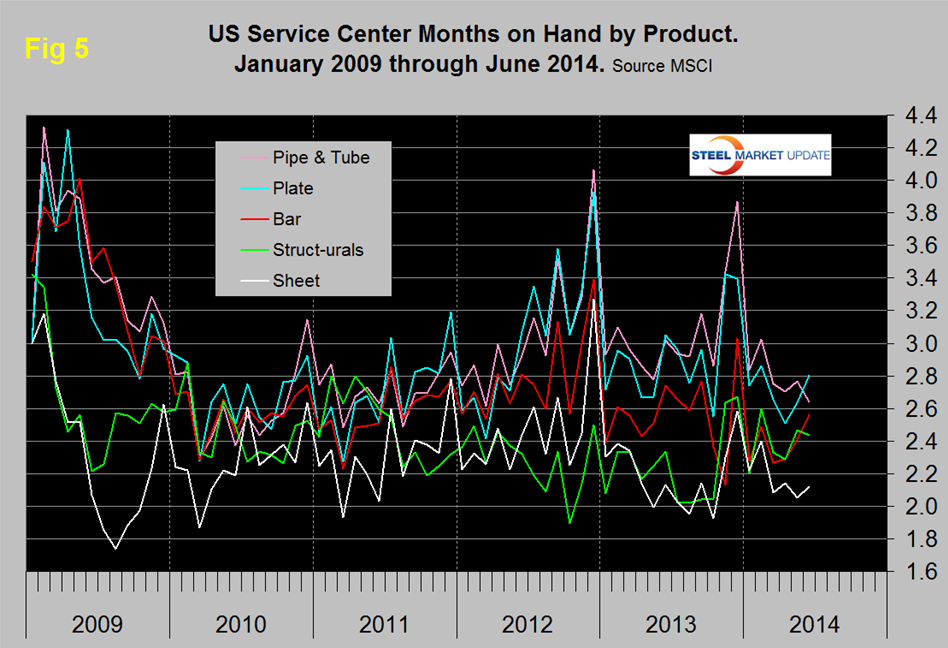
Figure 5 shows the change of inventory at service centers since 2009 measured as months on hand. Tubulars and structurals experienced a decrease in MoH at the end of June, there was a strong increase in bar and plate and a smaller increase of structurals. Sheet products constitute by far the largest segment of service center’s business, they have had the best inventory management since 2009 and currently have the lowest months on hand.