

Market Data

July 18, 2014
Currency Update for Steel Trading Nations - July 11th 2014
Written by Peter Wright
Explanation of data sources: The broad index is published by the Federal Reserve on both a daily and monthly basis. It is a weighted average of the foreign exchange values of the U.S. dollar against the currencies of a large group of major U.S. trading partners. The index weights, which change over time, are derived from U.S. export shares and from U.S. and foreign import shares. The data are noon buying rates in New York for cable transfers payable in the listed currencies.
![]() At SMU we use the historical exchange rates published in the Oanda Forex trading platform to track the currency value of the US $ against that of sixteen steel trading nations. Oanda operates within the guidelines of six major regulatory authorities around the world and provides access to over 70 currency pairs. Approximately $4 trillion US $ are traded every day on foreign exchange markets. The Broad Index value of the US $ has been gradually strengthening for almost two years, (Figure 1), and is up by 3.4 percent since the end of 2012. Since mid-2011, the dollar has strengthened by 7.7 percent. This favors imports to the US and depresses exports. The currencies of the steel trading nations do not necessarily follow the broad index and in fact as a generalization can sometimes move in the opposite direction.
At SMU we use the historical exchange rates published in the Oanda Forex trading platform to track the currency value of the US $ against that of sixteen steel trading nations. Oanda operates within the guidelines of six major regulatory authorities around the world and provides access to over 70 currency pairs. Approximately $4 trillion US $ are traded every day on foreign exchange markets. The Broad Index value of the US $ has been gradually strengthening for almost two years, (Figure 1), and is up by 3.4 percent since the end of 2012. Since mid-2011, the dollar has strengthened by 7.7 percent. This favors imports to the US and depresses exports. The currencies of the steel trading nations do not necessarily follow the broad index and in fact as a generalization can sometimes move in the opposite direction.
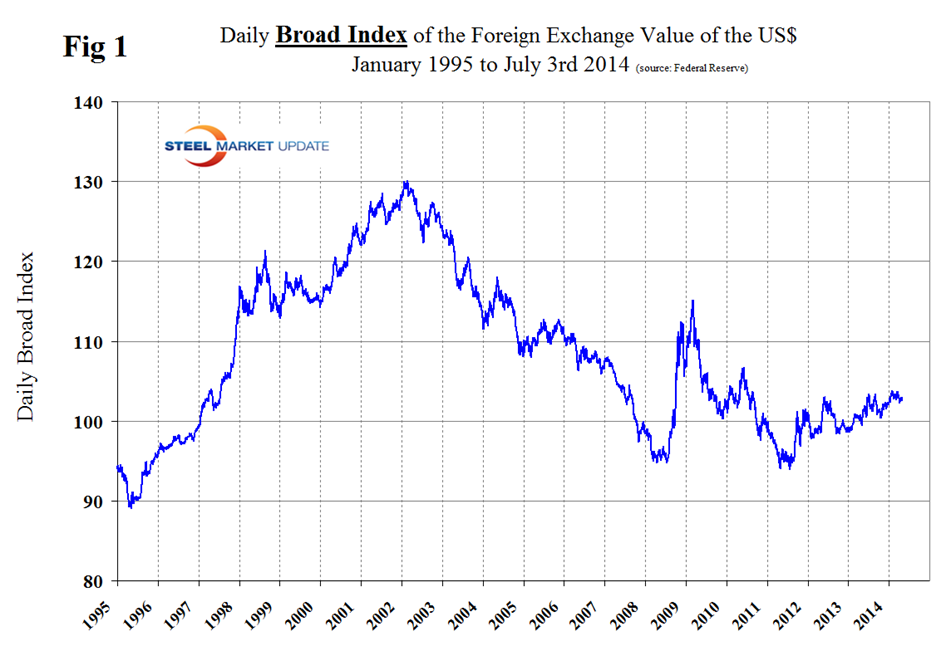
Table 1 shows the number of currency units that it takes to buy one US $ and the percent change in the last year, three months, one month and seven days. The following major changes have occurred in the last 12 months; the UK pound and the Korean Won have strengthened by 15 percent and 12.3 percent respectively and the Ukrainian Hryvnia has declined by 29.7 percent.
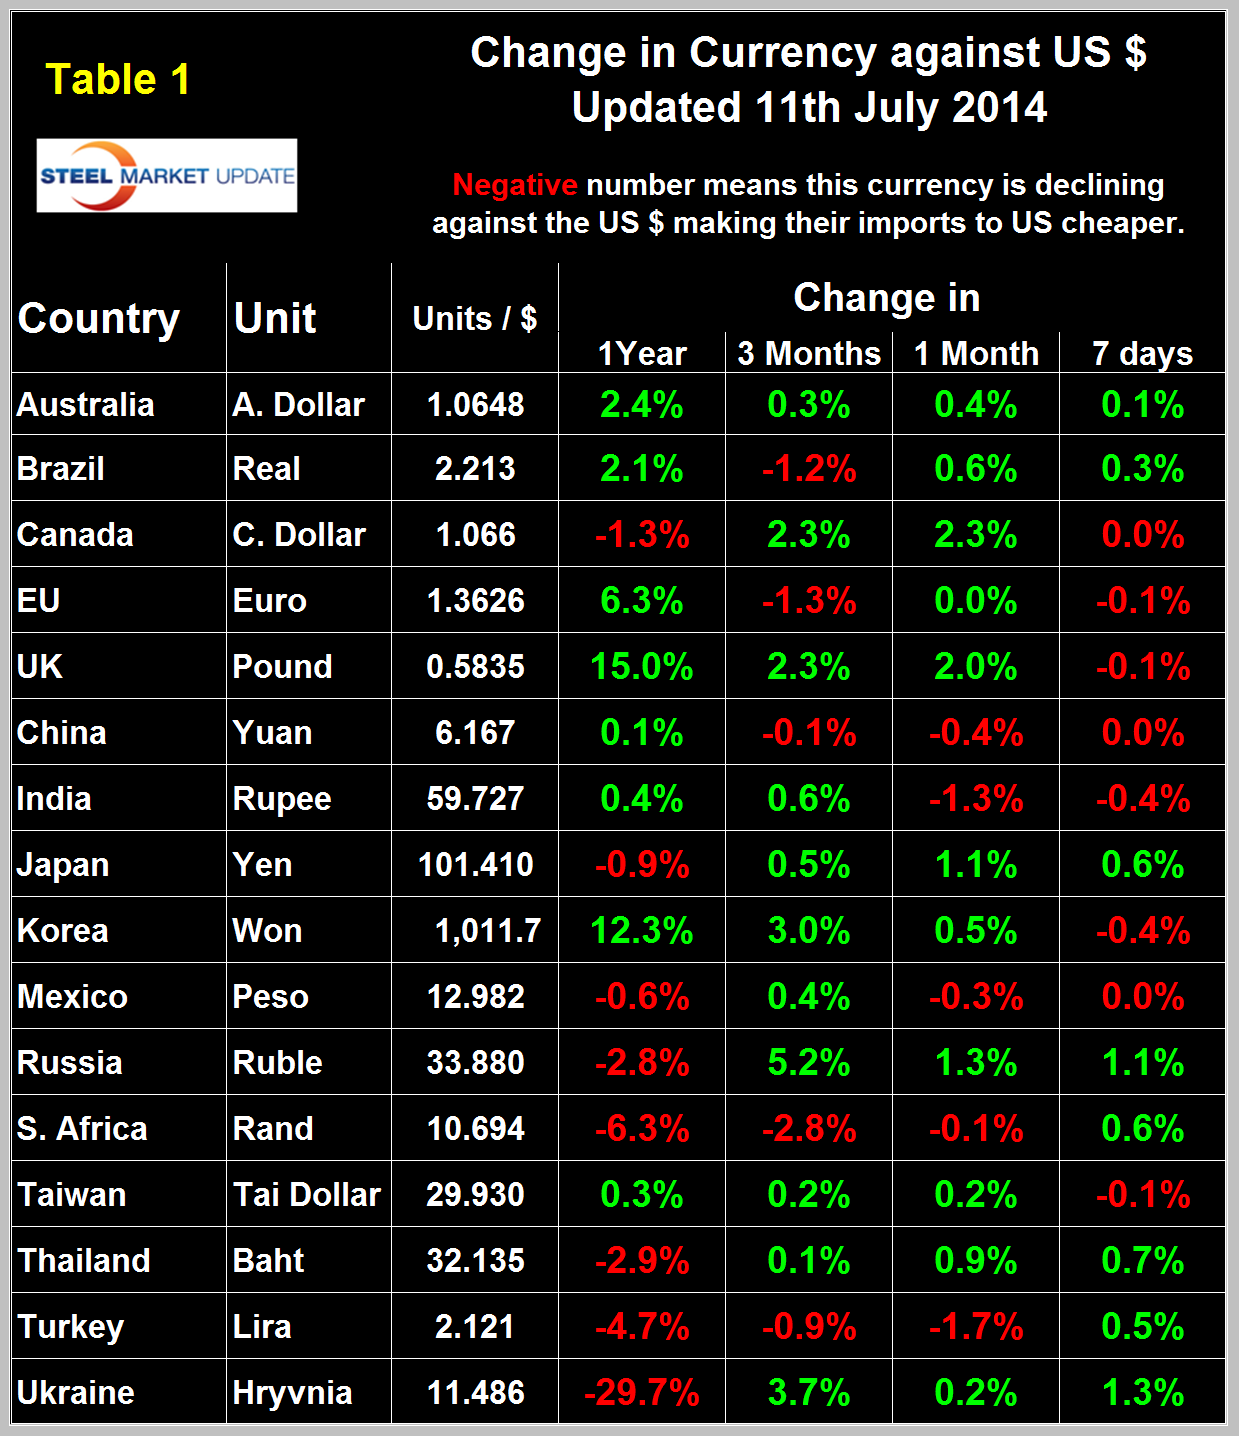
The Hryvnia and the Russian Ruble have both been recovering for the last three months. The Executive Board of the IMF in its Article IV Consultation with the Russian Federation reported last week that the Central Bank of the Russian Federation (CBR) raised policy rates by 1.5 percentage points in early March and a further .5 percentage point in April and reduced exchange rate flexibility in response to the onset of geopolitical tensions. The CBR also increased to US$1.5 billion the cumulative interventions required to move the exchange rate corridor, lowering the flexibility of its FX rule. The discretionary policies followed by the authorities helped contain the heightened currency and liquidity stress. By the end of May, as the exchange rate traded firmly in the non-intervention zone, the CBR took steps to allow more exchange rate flexibility.
The overall picture for the steel trading nations is that in the last year the US $ has strengthened against eight of the currencies of the major sixteen steel trading nations and weakened against eight also. Table 1 is color coded to indicate strengthening of the foreign currency in green and weakening in red. We regard strengthening of the US Dollar as negative and weakening as positive because the effect on net imports. The biggest change in the last 30 days has been a 2.3 percent strengthening of the Canadian dollar to 1.066 to the US $ on July 11th. In the last month the US $ has weakened against eleven of the currencies of steel trading nations.
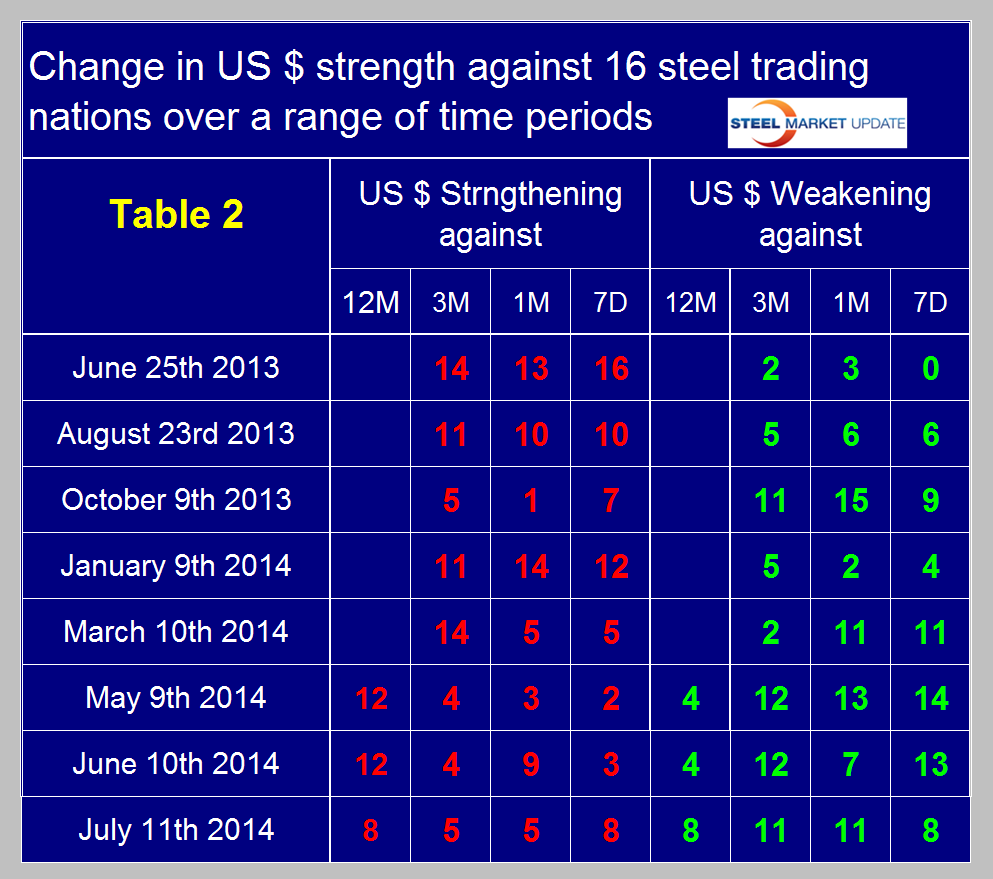
Table 2 attempts to clarify the overall change in the currency values of the sixteen steel trading nations and summarizes the points made above about direction over time.
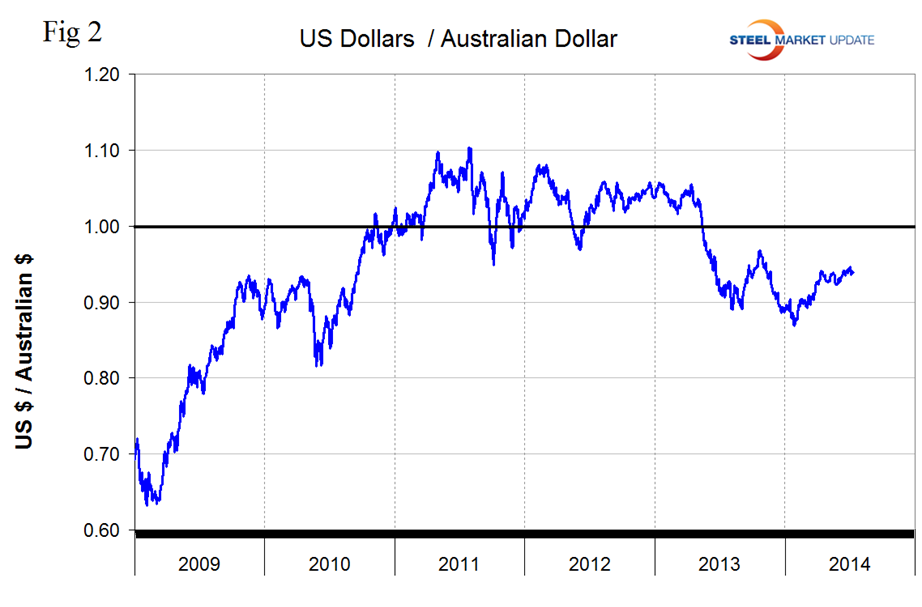
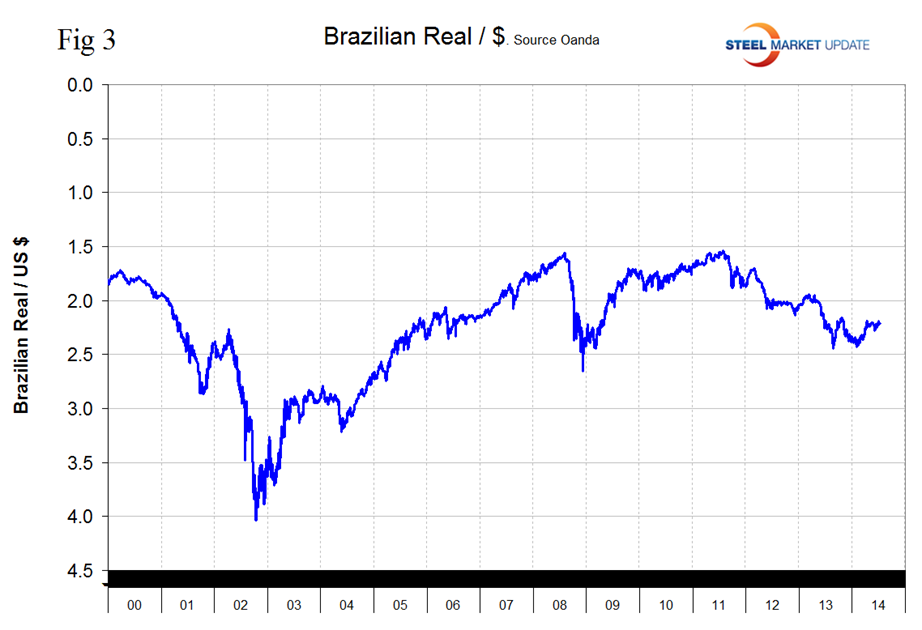
There has been a general weakening of the currencies of the major iron ore producing nations, Australia and Brazil, since mid-2011 but both have strengthened in the course of 2014, (Figure 2 and Figure 3). An increase in these currencies tends to support the global price of iron ore which is traded in US dollars.
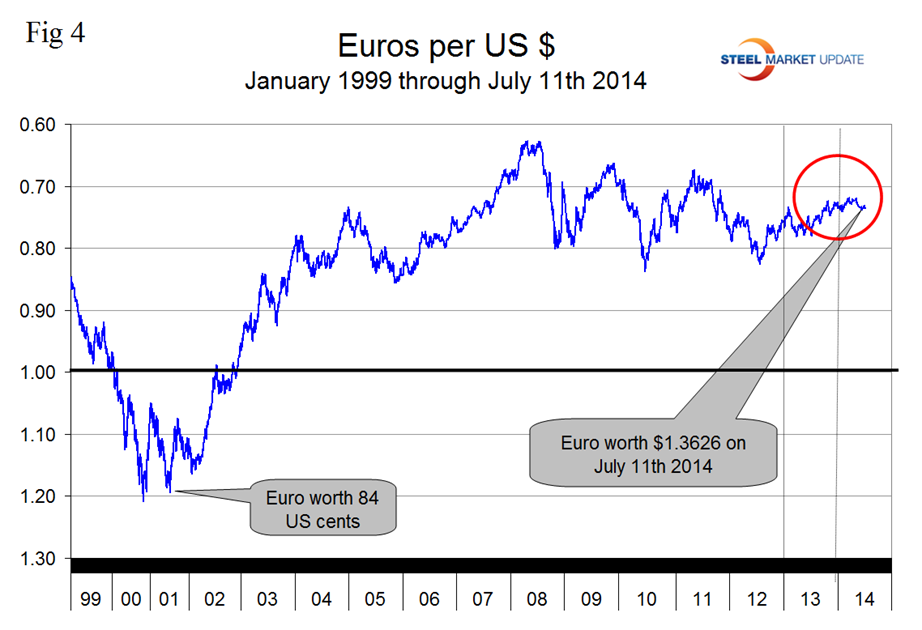
The Euro stood at 1.3626 on July 11th almost unchanged since our last report.The Euro has strengthened steadily for two years and by 6.3 percent against the US $ in the last twelve months, (Figure 4). A strengthening Euro makes US scrap more attractive to Turkish buyers than alternative sources in Europe and tends to suppress European steel exports to the US.
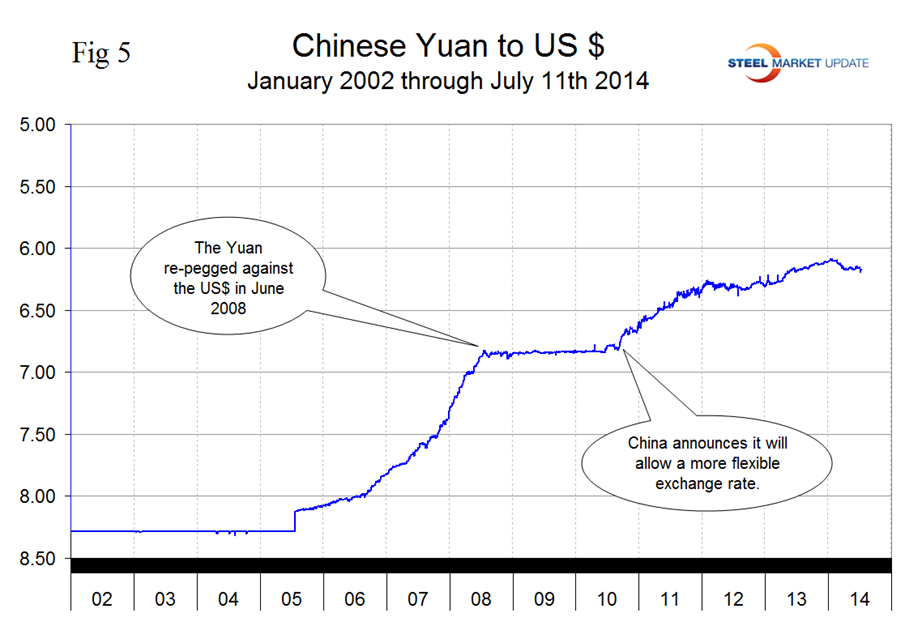
The Chinese Yuan peaked at 6.0987 on February 15th and has since weakened to 6.1669, a decline of 1.1 percent. After a period of strengthening the Yuan is almost back to where it was a year ago, (Figure 5). We understand that the policy of strengthening the Yuan that existed since Q3 2010 has been abandoned and that the currency will float more freely in future. There are increasing commentaries in the press about China’s intent to increasingly promote the Yuan as a reserve currency in competition with the US $. Armada reported on June 21st, “China appears to be supporting the anti-dollar strategy Putin laid out in actions – perhaps not in words. Just this week, they have negotiated a trade deal with the EU in which the Rmb and various EU currencies would be used in the transaction – bypassing the dollar as an intermediary.” See more on this below.
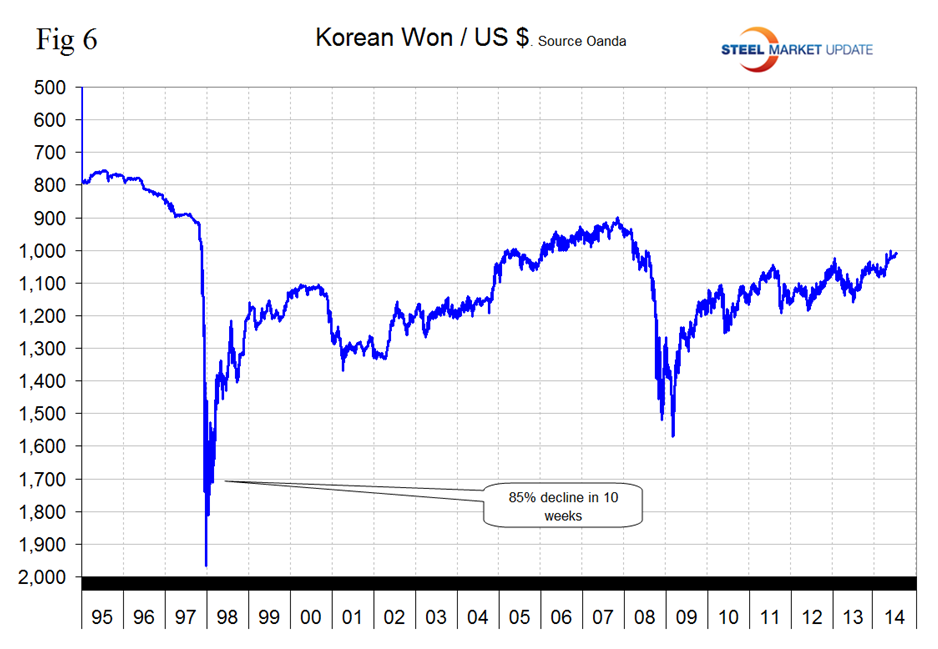
The Korean Won is currently at its highest level in six years, a trend that has strengthened in the last four months, (Figure 6).
From Seeking Alpha June 30th abridged by SMU:
Could China And Russia Be Trying To Kill The Petrodollar Standard?
One of the most significant sources of strength for the U.S. dollar since the end of the gold standard in the early 1970s has been the petrodollar standard. This standard came into being following the close of the gold window in 1971 when President Nixon agreed to provide arms and protection to Saudi Arabia in exchange for the Kingdom denominating all sales of oil in U.S. dollars. As Saudi Arabia was and still is the largest producer of oil in OPEC and the largest exporter of oil in the world, other nations quickly followed suit and thus the petrodollar standard was born.
The petrodollar standard ensures a strong demand for U.S. dollars by countries all over the world as well as a strong demand for U.S. Treasury securities. This is because countries that import oil require large quantities of U.S. dollars to purchase all the oil that they import (because all purchases of oil are ultimately done in U.S. dollars). These dollars must be purchased in the open market, which creates demand for dollars. Many of these countries may not want as many U.S. dollars if they did not need to buy these dollars in order to purchase the oil imports that they need. Thus, the petrodollar standard creates artificial demand for U.S. dollars by creating demand in excess of what the market would normally desire. Because the importing countries are paying in dollars for their oil, the countries that are exporting oil are thus receiving these dollars, which accumulate on the balance sheets of their respective central banks when the companies that are actually conducting the oil sales exchange these dollars for their local currencies. Historically, the most logical thing for these central banks to do with all these dollars was to lend them back to the United States Federal Government through the purchase of Treasury securities. This was due largely to their convenience, liquidity, and perceived safety. Ultimately, the U.S. dollar’s dominance in the oil trade led to it becoming dominant in all forms of trade. This led to exporting manufacturing powerhouses such as China and Japan amassing large quantities of dollars on the balance sheets of their central banks, which they also recycled back into Treasury securities just as the oil exporting nations had done. The recycling of all of these trade and oil dollars back into Treasury securities has generated artificial demand for Treasuries that would not have been present in the absence of this standard. This allowed the United States’ governments, companies, and citizens (since most interest rates on loans are tied to Treasury rates) to borrow more money at lower interest rates than they would ordinarily be able to.
Unfortunately, there are some signs that the petrodollar’s dominance is beginning to be challenged. On April 24, officials from the Russian government held a secret meeting with executives from several of the country’s largest companies (including some of the largest oil and gas companies in the world) regarding ways in which the country can reduce the use of the U.S. dollar in its export operations. As Russia is the largest exporter of natural gas and second largest exporter of oil in the world, that country’s move away from the United States dollar would obviously significantly reduce the importance of the dollar in the international oil trade upon which the petrodollar depends.
In order for Russia to move away from using the U.S. dollar in its export operations, it would need to find trade partners who also support such a move. It has found such a partner in China. China is the world’s largest importer of oil and so its desires can understandably command a major role in the international oil market. These desires are somewhat at odds with the continued dominance of the petrodollar. As fellow Seeking Alpha contributor Russ Winter points out, China is actively attempting to use the renminbi to pay for all of the oil and gas that it imports. Several of the world’s largest energy exporters have already agreed to accept the Chinese currency including Russia, Iran, and the United Arab Emirates. There has been much speculation that Venezuela, another major oil exporter, will also begin selling oil in Yuan. This is largely due to Venezuela having much better diplomatic relations with China than with the United States. However, this has not happened as of yet. Should it occur though, it would represent a further reduction to the petrodollar’s dominance.
At this time, the petrodollar standard is still being supported by the largest exporter of oil in the world, Saudi Arabia. But even this support may be waning. The reason for this is quite simple. Saudi Arabia currently exports more oil to China than to the United States and as already discussed, China is actively working to conduct all of its international energy purchases in renminbi. When we consider that China is now the Kingdom’s largest customer, it is easy to see how China may be able to exert more influence than the United States. Unfortunately, there are some signs that Saudi Arabia may be beginning to accede to the Chinese preference. One piece of evidence for this is a recent partnership between Saudi Aramco, the Saudi Arabian national oil company, and China’s Sinopec. According to an article in China Daily, the two companies have teamed up to construct a massive oil refinery in the Red Sea port of Yanbu. This refinery, expected to be completed in 2014, will process approximately 400,000 barrels of heavy crude oil per day, which will presumably be sold to China. The two countries have also entered into some other agreements together, such as one to work together on the peaceful usage of nuclear energy. This shows that the relationship between Saudi Arabia and China is growing stronger at the same time that the United States is growing its own oil production at home. This situation could lead to Saudi Arabia eventually abandoning its support for the petrodollar and beginning to sell oil in other currencies, particularly Chinese Yuan. If Saudi Arabia abandons the petrodollar standard then the whole standard could collapse as the two largest oil exporters in the world would no longer be supporting it and the petrodollar’s dominance largely depends on the support of oil exporting nations.


