

Market Data
August 16, 2014
Producer Price Indexes of Sheet Steel, Aluminum, Plastic and Transportation - July 2014
Written by Peter Wright
Each month the Bureau of Labor Statistics (BLS) puts out its series of Producer Price Indexes (PPI) for thousands of goods and materials. The latest release on Friday reported July results. These statistics are a useful way to evaluate any changes in the competitive position of steel against competing materials and rail vs truck transportation. See below for the official description of this program.
The July report from the BLS reads as follows: The Producer Price Index for final demand rose 0.1 percent in July, seasonally adjusted, the U.S. BLS reported today. This increase followed a 0.4-percent advance in June and a 0.2-percent decline in May. On an unadjusted basis, the index for final demand climbed 1.7 percent for the 12 months ended in July. In July, the 0.1-percent increase in final demand prices can be traced to the index for final demand services, which also rose 0.1 percent. Prices for final demand goods were unchanged. Within intermediate demand, prices for processed goods advanced 0.1 percent, the index for unprocessed goods dropped 2.7 percent, and prices for services moved up 0.3 percent.
For the purpose of this report, SMU has extracted comparative statistics for sheet steel, aluminum and plastic products and truck and rail transportation. Table 1 is a summary of each category on a year over one, two and three year basis. One cell in this table for plastic water pipe contains the code n/a because this data series is too new to make a 36 month comparison.
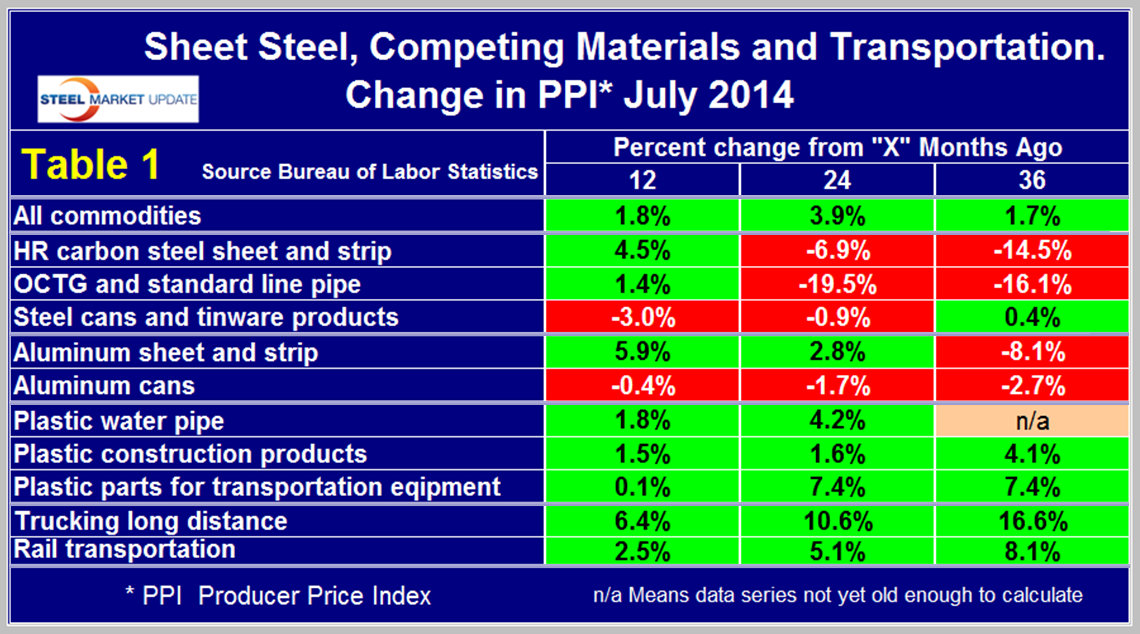
What the PPI data shows is that the acceleration in commodity prices slowed to 1.8 percent in 12months through July from 3.9 percent in 24 months through July. Both hot rolled carbon sheet and strip and OCTG reversed course in a positive direction in July. The price of steel cans and tin-ware products declined by 3.0 percent in the last 12 months and made some competitive progress against aluminum cans after years of declining competitiveness. Steel became less competitive against plastic piping, construction products and construction equipment parts in the last 12 months after making progress in 24 and 36 months.
The PPI data are helpful in monitoring the price direction of steel and steel products against competing materials and products. As far as we at SMU can tell from comparison with known transaction prices, these PPI are a good representation of the real world. However our observation is that the actual values of the PPIs of different products cannot be compared with one another because they are developed by different committees within the BLS. We believe that this data is useful only in comparing the direction of prices in the short and medium term.
Table 1 also shows price changes for truck and rail transportation and indicates that highway delivery has lost ground to rail in the last 12, 24 and 36 month periods.
The official description from the Bureau of Labor Statistics, (BLS) reads as follows. The Producer Price Index (PPI) is a family of indexes that measure the average change over time in the prices received by domestic producers of goods and services. PPIs measure price change from the perspective of the seller. This contrasts with other measures, such as the Consumer Price Index (CPI). CPIs measure price change from the purchaser’s perspective. Sellers’ and purchasers’ prices can differ due to government subsidies, sales and excise taxes, and distribution costs. More than 9,000 PPIs for individual products and groups of products are released each month. PPIs are available for the products of virtually every industry in the mining and manufacturing sectors of the U.S. economy. New PPIs are gradually being introduced for the products of industries in the construction, trade, finance, and services sectors of the economy. More than 100,000 price quotations per month are organized into three sets of PPIs: (1) Stage-of-processing indexes, (2) commodity indexes, and (3) indexes for the net output of industries and their products. The stage-of processing structure organizes products by class of buyer and degree of fabrication. The commodity structure organizes products by similarity of end use or material composition. The entire output of various industries is sampled to derive price indexes for the net output of industries and their products.
Stage-of-Processing Indexes: Within the stage-of-processing system, finished goods are commodities that will not undergo further processing and are ready for sale to the final-demand user, either an individual consumer or business firm. Finished consumer goods include durable goods such as automobiles, household furniture, and appliances, as well as nondurable goods such as apparel and home heating oil. Capital equipment includes durable goods such as heavy motor trucks, tractors, and machine tools.
The stage-of-processing category for intermediate materials, supplies, and components consists partly of commodities that have been processed but require further processing. Examples of such semi-finished goods include flour, cotton yarn, steel mill products, and lumber. The intermediate goods category also encompasses nondurable, physically complete items purchased by business firms as inputs for their operations. Examples include diesel fuel, belts and belting, paper boxes, and fertilizers.
Crude materials for further processing are products entering the market for the first time that have not been manufactured or fabricated and that are not sold directly to consumers. Crude foodstuffs and feedstuffs include items such as grains and livestock. Examples of crude nonfood materials include raw cotton, crude petroleum, coal, hides and skins, and iron and steel scrap.


