

Prices

October 7, 2014
Steel Exports Bounce Back
Written by Brett Linton
Below is a press release issued by The American Institute for International Steel (AIIS) titled “Steel Exports Show Monthly Increase, Yearly Decline”
Falls Church, VA. October 7, 2014. Steel exports from the United States bounced back in August following a late spring-early summer dip.
August exports increased 4.1 percent from their July level to total 1.05 million net tons. Exports had fallen 3.3 percent in July, after being nearly unchanged in June and dipping 4.1 percent in May. Despite the increase, steel exports were still 8.6 percent below what they were in August 2013.
Exports to Canada accounted for nearly the entire increase in August, as they expanded 7.5 percent to 577,071 net tons, while sales to Mexico were down 1.6 percent to 360,778 net tons. The Canada total, though, was 1 percent below the August 2013 level, while the Mexico number was 3.9 percent higher. Exports to the European Union were up 15.4 percent to 30,774 net tons, almost exactly where they were a year earlier.
For the year, exports are down 6.9 percent to 8.12 million net tons, with a 4.4 percent drop in sales to Canada and sharp decreases in exports to several Latin American countries driving the decline. Exports to the Dominican Republic, Panama, Peru, Colombia and Ecuador dropped a total of nearly 300,000 net tons. Also, exports to the European Union were down 15.5 percent to 229,674 net tons. Partially offsetting the drops, exports to Mexico were up 2.8 percent to 2.78 million net tons and exports to Venezuela nearly doubled to 45,895 net tons.
The export numbers demonstrate the power of free trade. While overall exports were down nearly 7 percent for the first eight months of the year, exports to the U.S.’s two North American Free Trade Agreement (NAFTA) partners – Canada and Mexico – slipped just 1.7 percent. If not for the absence of many restrictions on trade with our immediate neighbors to the north and south, steel exports could be much smaller than they are.
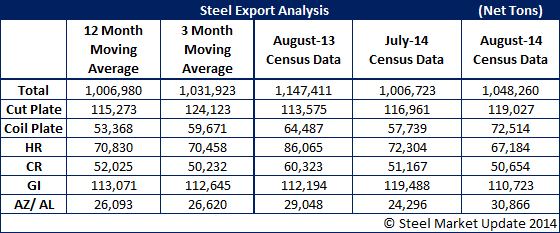
Below is a table by Steel Market Update showing an overview of select steel exports, including the latest month, one month prior, one year prior, and a moving average analysis.
Below is an interactive graphic of our steel exports history; note that our interactive graphics can only be seen when you are logged into the website and reading the newsletter online. If you need help logging in to the website or navigating it, feel free to contact us at info@SteelMarketUpdate.com or 800-432-3475.
{amchart id=”107″ Total Exports- All Products, Monthly, Net tons}


