

Market Segment
October 17, 2014
Service Center Intake, Shipments and Inventory September 2014
Written by Peter Wright
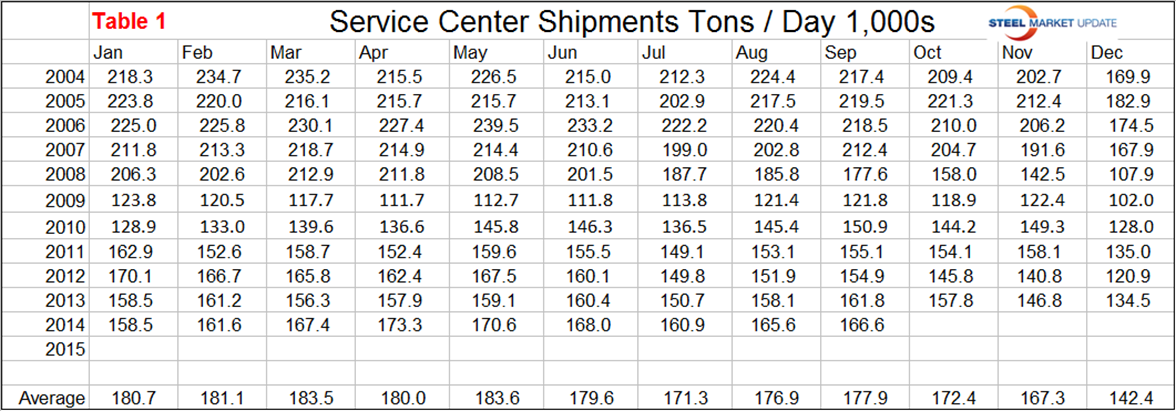
Total service center carbon steel shipments in September increased by 21,100 to 3.498 million tons. Shipping days were unchanged at 21. On a tons per day basis, (t/d) shipments increased from 165,600 tons in August to 166,600 in September. In each of the last four months t/d shipments for each particular month was the best since 2008.
Daily shipments in September increased by 0.6 percent from August, the average increase August to September since 2004 has been 0.5 percent. Figure 1 demonstrates the seasonality of service center shipments and why comparing a month’s performance with the previous month is usually misleading. For this reason in the SMU analysis we always consider year over year changes.
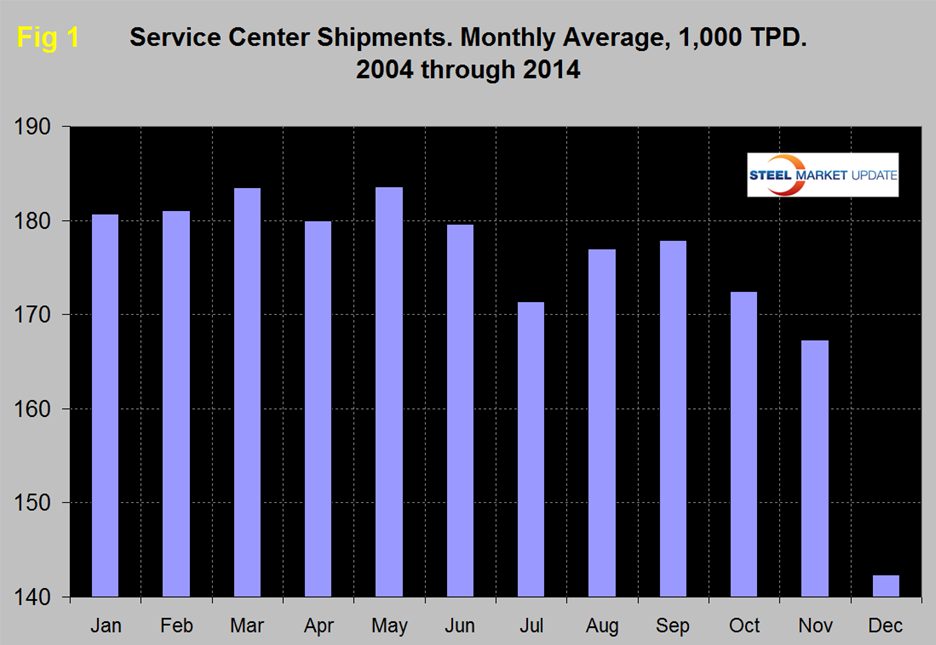
The raw numbers for Figure 1 are shown in Table 1.
In September intake at 181,900 tons exceeded shipments by 15,300 tons. Table 2 shows the performance by product in September compared to the same month last year and also with the average t/d for September 2014, September 2013 and September 2012. We then calculate the percent change between September 2014, September 2013 and with the 3 year September average. We hope this give the best view of market direction. Shipments of all products on a t/d basis were up by 3.0 percent from September last year and up by 3.4 percent from the average September shipments for 2014, 2013 and 2012. The fact that the single month comparison is close to the three year comparison leads us to the conclusion that the improvement is stable. This is not true of individual products where all except sheet are accelerating, plate being particularly strong. Sheet products are slowing. The t/d shipments of structurals were the best since November 2008 when the market was collapsing.
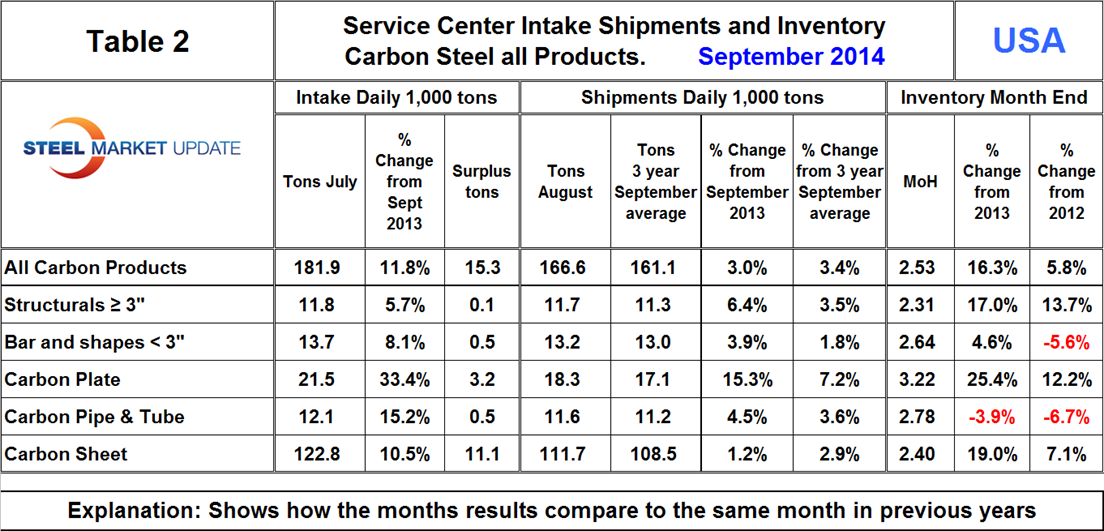
September total carbon steel intake increased by 2,880 t/d, the highest daily volume since January 2012 and led to a surplus of 15,300 t/d. All products had an intake surplus in September. Months on hand, (MoH) increased from 2.45 at the end of August to 2.53 at the end of September.
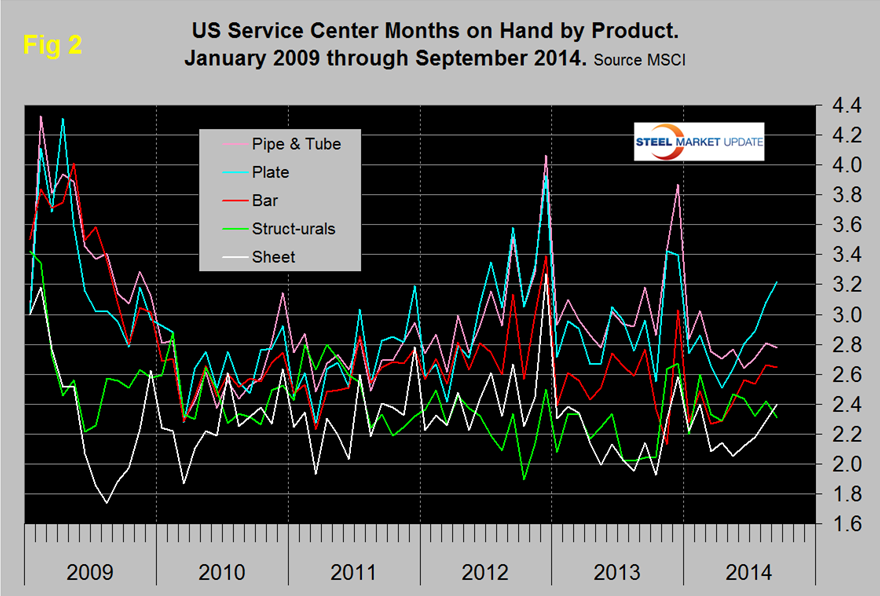
Compared to the end of September last year, moth end inventories were up by 16.3 percent in total, with only pipe and tube experiencing a contraction. Plate was up 25.4 percent and sheet up 19.0 percent. Figure 2 shows the MoH by product since January 2009. Plate and bar inventories have increased markedly in the last five months, sheet was also up significantly in the last four. Sheet products constitute by far the largest segment of service center’s business, have had the best inventory management since 2009, currently only structurals has a lower months on hand.
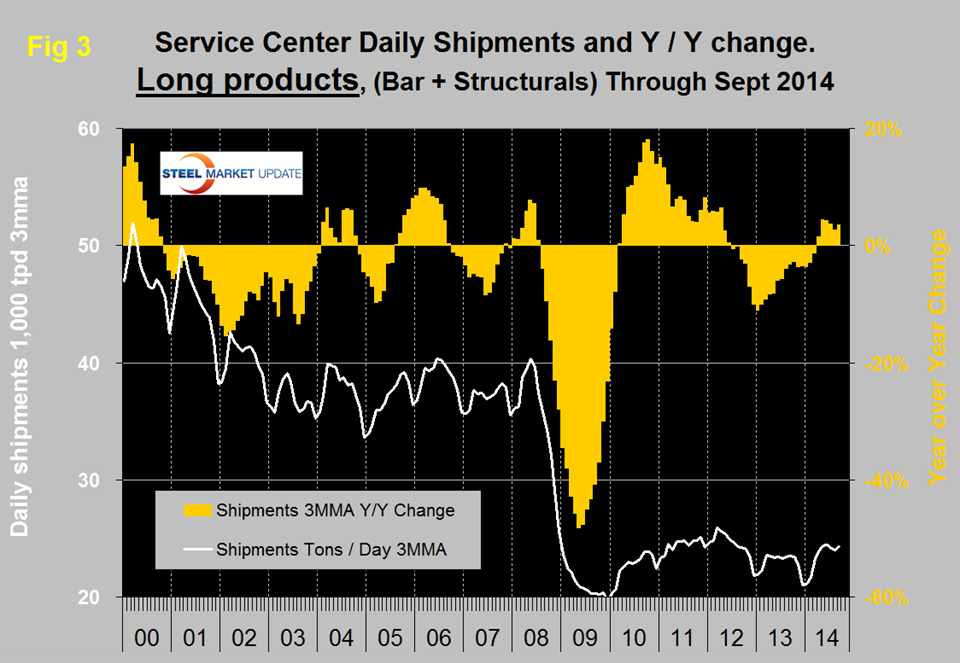
There continues to be a wide difference between the performances of flat rolled, (sheet + plate) and long products, (structurals + bar) at the service center level. Long products have had a very poor recovery from the recession. On a 3MMA basis y / y, the growth of shipments was negative for 21 straight months until April this year which was the first of six straight months of growth, (Figure 3).
Flat rolled has had a much better recovery since mid-2009 and has had positive y / y growth in each of the last fourteen months, (Figure 4). In 2006 and 2007, the mills and service centers were operating at maximum capacity.
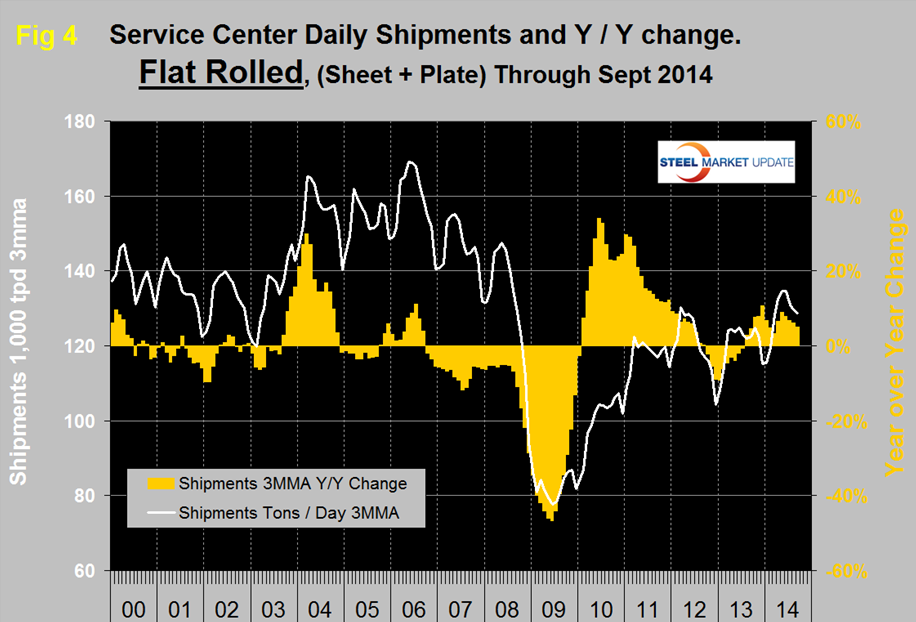
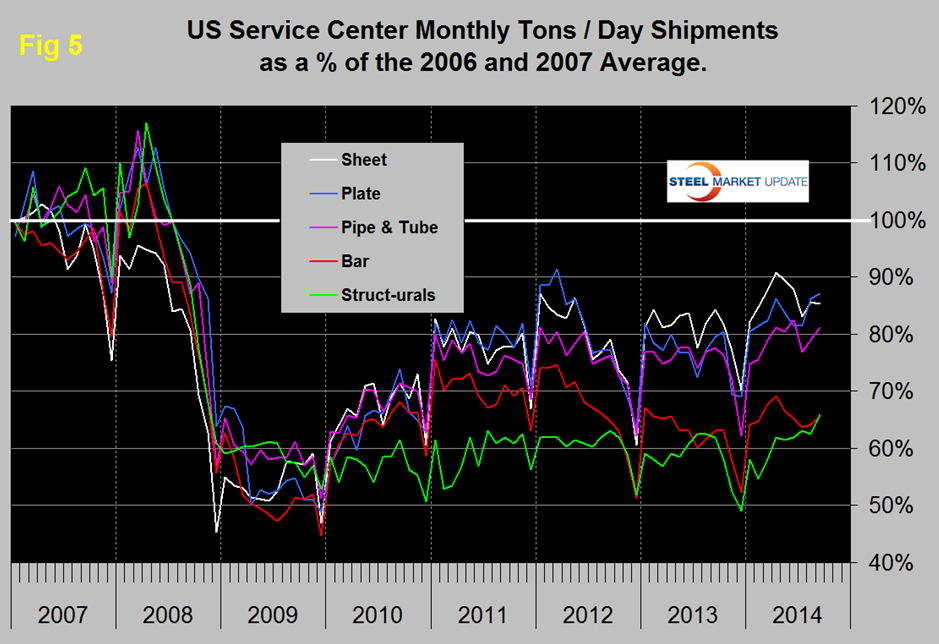
Figure 5 takes the shipments by product since that time frame and indexes them to the average for 2006 and 2007 in order to measure the extent to which service center shipments of each product have recovered. Again it can be seen that bar and structurals have the worst record. Sheet has had the best recovery since the beginning of 2013 but plate caught up in August. Even so the recovery of sheet is only at 85.3 percent and plate at 87.1 percent. The total of carbon steel products is now at 78.5 percent of the shipping rate that existed in 2006 and 2007, with structurals and bar at 65.9 percent and 65.7 percent respectively. The recovery of the service center sector has been much slower than has been experienced by the mills. Presumably this is because more buyers are purchasing mill direct and this is probably particularly true of long products. In addition long products being more construction oriented are suffering from the slow recovery of that business sector.
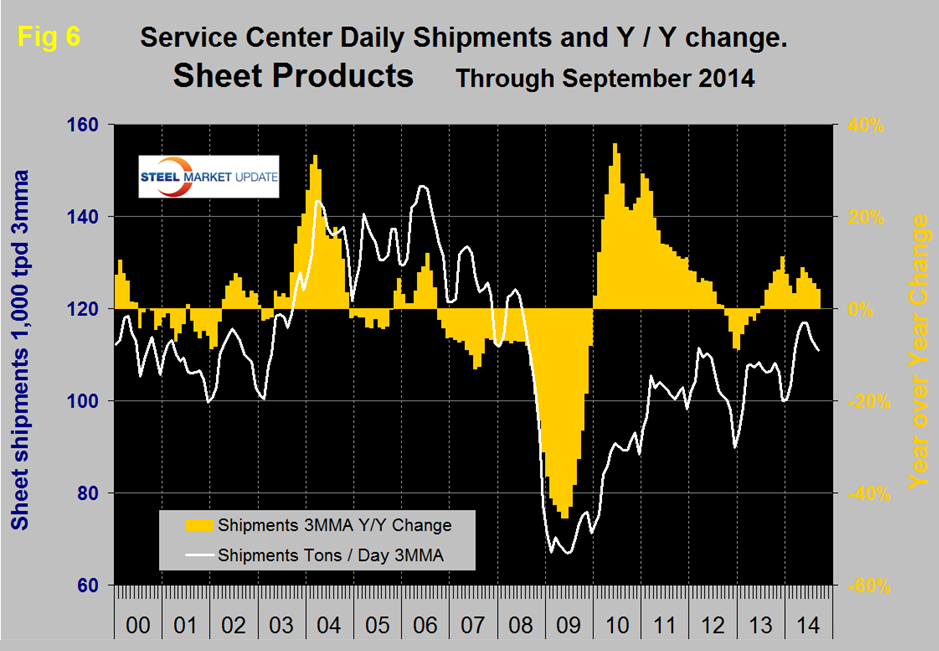
MSCI uses product nomenclature flat and plate. In our analysis at SMU we replace the term flat with sheet. By our interpretation of the MSCI’s data their definition of “flat” is all hot rolled, cold rolled and coated sheet products. Since most of our readers are sheet oriented we have removed plate from Figure 4 to highlight the history of sheet products which are shown in (Figure 6). Positive year over year growth has occurred in each of the last fifteen months following nine consecutive months of decline.
The SMU data base contains many more product specific charts than can be shown in this brief review. For each product we have ten year charts for shipments, intake, inventory tonnage and months on hand. Readers are welcome to these on request but please don’t ask for all of them at once!


