

Prices

October 21, 2014
2014 Flat Rolled Imports Looking to be 3rd Highest Year on Record
Written by Paul Lowrey
Everyone is aware of the high level of flat rolled imports in 2014 – especially cold rolled and coated products. So, where does 2014 rank on a historical basis? It is on pace to be the third highest year on record.
We have 8 months of actual import data on the books. August year-to-date flat rolled imports total about 9.2 million tons. This includes all products in coil form (hot rolled, cold rolled, all coated, and tin mill products), but excludes stainless grades. On an annualized basis, flat rolled imports are on pace for 13.7 million tons in 2014.
One adjustment is necessary. Some of the hot rolled imports are feedstock to Western mills that convert it to cold rolled, coated, and tin mill products. It should be excluded from “market” or “trade” imports on the same basis that imported semi-finished products are excluded from apparent supply. Depending on the year and market conditions, these hot rolled imports typically range from 1.0 to 1.25 million tons. Accordingly, the “market” or “trade” imports for 2014 are on course for about 12.5 million tons.
Chart 1 shows the ten highest flat rolled import years – both in tons and percentage of apparent supply (please note the years are different in each of the bar charts). As shown, 2014F (annualized basis) would be the third highest on record under both measurements. The all-time record occurred in 1998 and was the result of the Asian financial crisis when massive amounts of imports were dumped in the U.S.
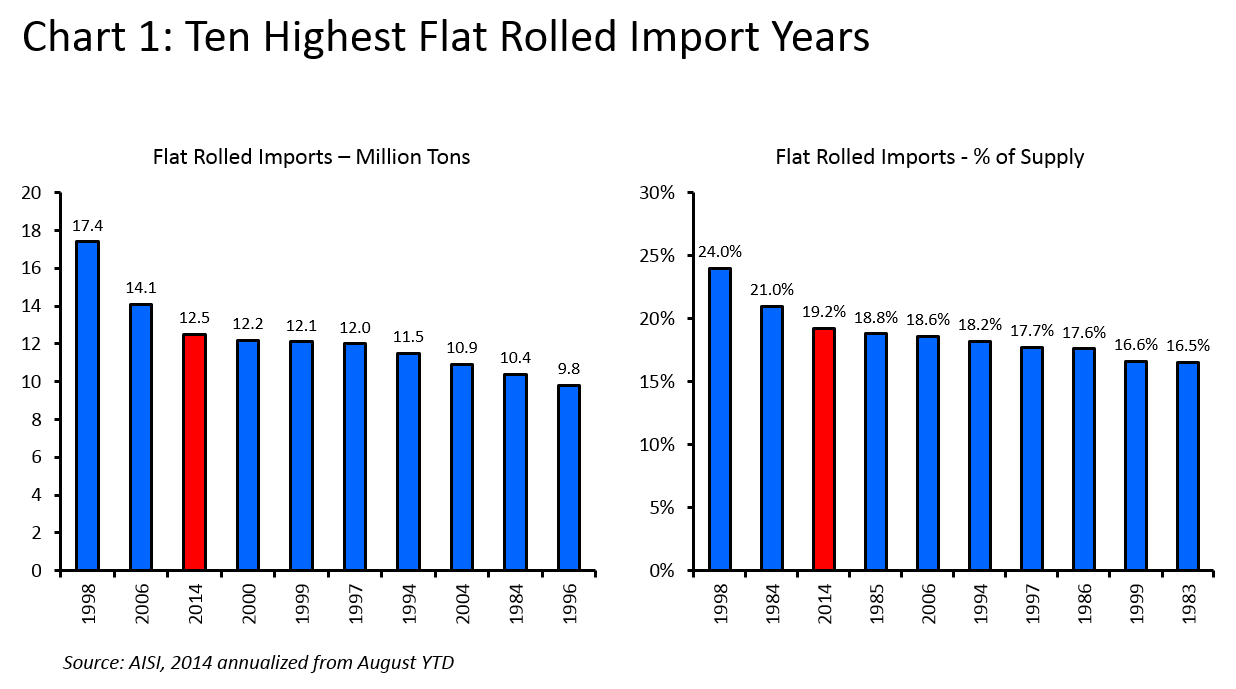
Chart 2 shows 2014F (annualized basis) flat rolled imports by product type – both in tons and percentage of apparent supply. Hot rolled, cold rolled, and HDG make up about 90 percent of the total flat rolled market. Accordingly, the imported tons are concentrated in these three product categories.
On a percentage of supply basis, however, imports are supplying one-third of the tin mill products (TMP) market and nearly 50 percent of the other metallic coated (OMC) market. In both cases, these are all time records (tons & percentage of supply). For those of you not familiar with OMC, it is an AISI “catch-all” category that includes Galvalume, Aluminized, and Galfan products. Galvalume and other aluminum-zinc alloys <AZ-50 coating weight comprise most of the import tons in this product category.
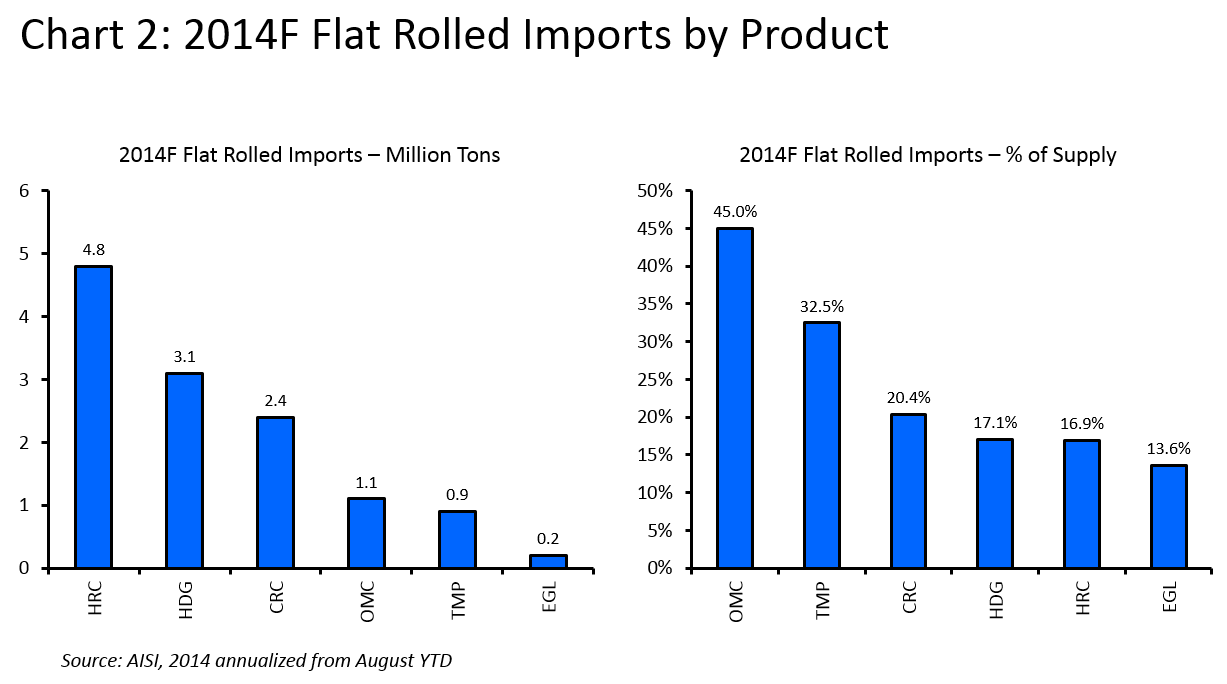
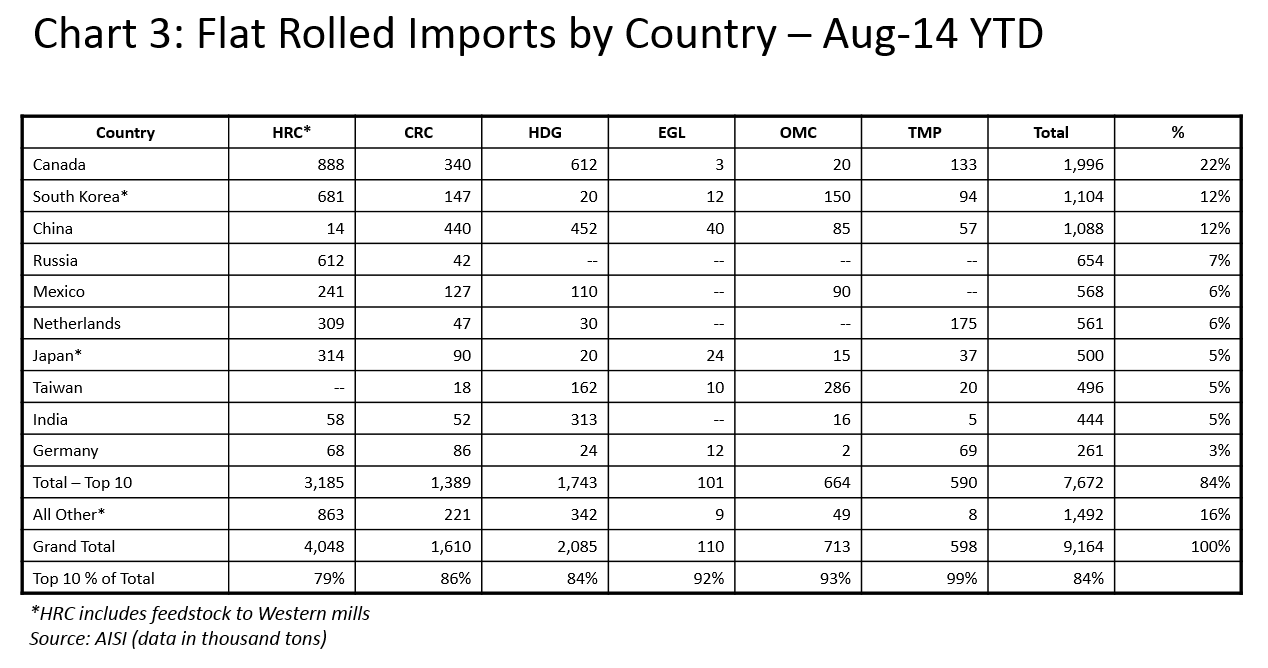
Chart 3 shows Aug-14 YTD flat rolled imports by country and by product category. This information is on a “gross” basis and does not include the hot rolled feedstock adjustment described previously. Canada is historically our largest trading partner in steel (both imports & exports). South Korea & China are tied for second at about 12 percent each. In all, the top ten importing countries are about 85 percent of all flat rolled imports.
At the SMU Steel Summit conference last month in Atlanta, there was some discussion about how big China really is in imports. This analysis shows that China is 12 percent of all flat rolled imports so far in 2014. In terms of all steel mill products (flat & long), China is 7 percent of the total in 2014.
One additional point should be made about flat rolled imports. It would be entirely appropriate to include welded pipe & tube in the flat rolled category because the product is manufactured mostly on hot rolled feedstock. In addition, imports of welded pipe & tube displace domestic production which would be supplied mostly from domestically produced hot rolled.
Year-to-date imports of welded pipe & tube are 3.7 million tons and would equal 5.5 million tons on annualized basis. Viewed from this perspective, welded pipe & tube would be the largest flat rolled import category.
Written by: Paul Lowrey, Steel Research Associates


