

Market Data

November 11, 2014
Consumer Income and Debt
Written by Peter Wright
If we start with the premise that the consumer is almost 70 percent of GDP and that steel consumption is closely correlated with GDP, then consumer behavior and, in particular, debt is very relevant to our future businesses. Consumer spending is driven by income and both the perception of current debt and willingness to take on more. The Federal Reserve reports of personal income and credit outstanding are important pieces of the jigsaw puzzle of steel demand, past present and future.
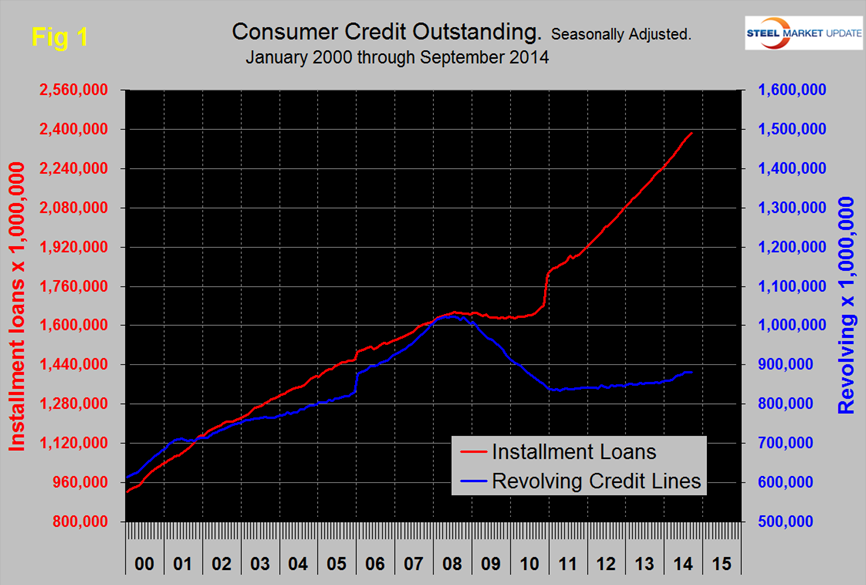
The Federal Reserve report G19 describes the quarterly situation of consumer credit; this represents loans for households, for financing consumer purchases of goods and services, and for refinancing existing consumer debt. Secured and unsecured loans are included, except those secured with real estate (such as mortgages and home equity loans and lines).The two categories of consumer credit are revolving and non-revolving debt. Revolving debt covers credit card use for purchases or cash advances, store charge accounts, and check credit plans that allow overdrafts up to certain amounts on personal accounts. It accounts for just more than 35 percent of consumer installment debt outstanding. Non-revolving includes auto loans, personal and student loans and other miscellaneous items such as recreation vehicle loans. Monthly data on consumer installment credit are based on the Federal Reserve’s monthly surveys of a sample of commercial banks, consumer finance companies, credit unions, and retailers. Benchmark data are available annually for commercial banks, savings and loans associations, mutual savings banks, and retailers, and every five years for finance companies. Total student loan debt outstanding exceeded total credit card debt outstanding for the first time in June 2010. Credit card debt represents as much as 98 percent of revolving credit. Revolving credit started declining in September 2008 when it reached a peak of $975.7 billion. The decrease is probably due a combination of higher minimum payments on credit cards, which were increased to 4 percent from 2 percent, lower credit card limits and tighter credit underwriting. Student loan debt, on the other hand, has been growing steadily because need-based grants have not been keeping pace with increases in college costs. Federal student loan debt outstanding reached approximately $665 billion and private student loan debt reached approximately $168 billion in June 2010, for a total student loan debt outstanding of $833 billion. Total student loan debt is increasing at a rate of about $2,853.88 per second and at the end of Q3 2014 was $1.307 trillion.
The change in the mix of consumer debt between installment (big ticket items) and revolving (credit cards) since the recession has been remarkable. Since January 2011 through September 2014, installment loans have grown by 31 percent and revolving loans by only 5 percent, (Figure 1). Consumers have clearly learned their lesson regarding the predatory nature of credit card lending and this sector has barely expanded in over three years. Installment debt now stands at $2.385 trillion, 55 percent of which is student loans, 39 percent is automotive loans and the remaining 16 percent is furniture, appliances, recreational vehicles etc.
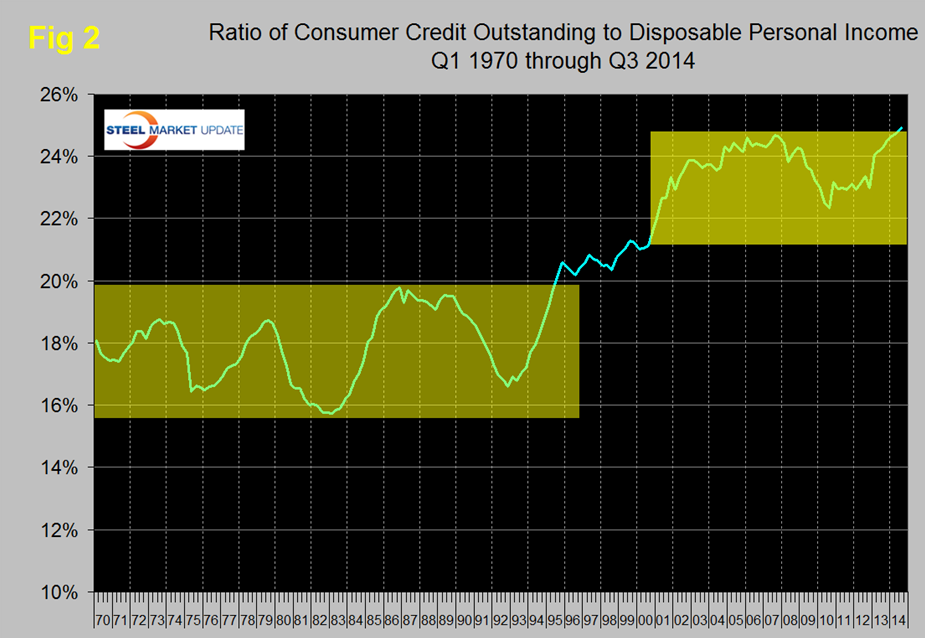
The ratio of consumer debt to personal disposable income rose from its long term range of 16 to 20 percent to over 24 percent, (Figure 2). This is only installment and revolving loans and does not include home mortgages. This ratio declined after the recession but is now at an all-time high having passed the previous peak of Q3 2007.
From John Mauldin, “Thoughts from the frontline” August 31st 2014. Excess debt and low investment in particular have hurt productivity. In fact, there has been very little growth in non-financial productivity over the last few years. And that lack of investment also probably means a halt to the improvement in the federal deficit. Monetary growth and low interest rates have worked to the extent that we are seeing half-full economic growth, which should continue. Yet, longer-term problems with debt, savings, and low investment weigh on growth potential. That is the real problem with the Keynesian-fueled recovery. It is fueled too much by debt and not enough productive income. We have borrowed from the future for decades, and now the future is here, and it’s payback time. And as we all know, payback is a bitch.
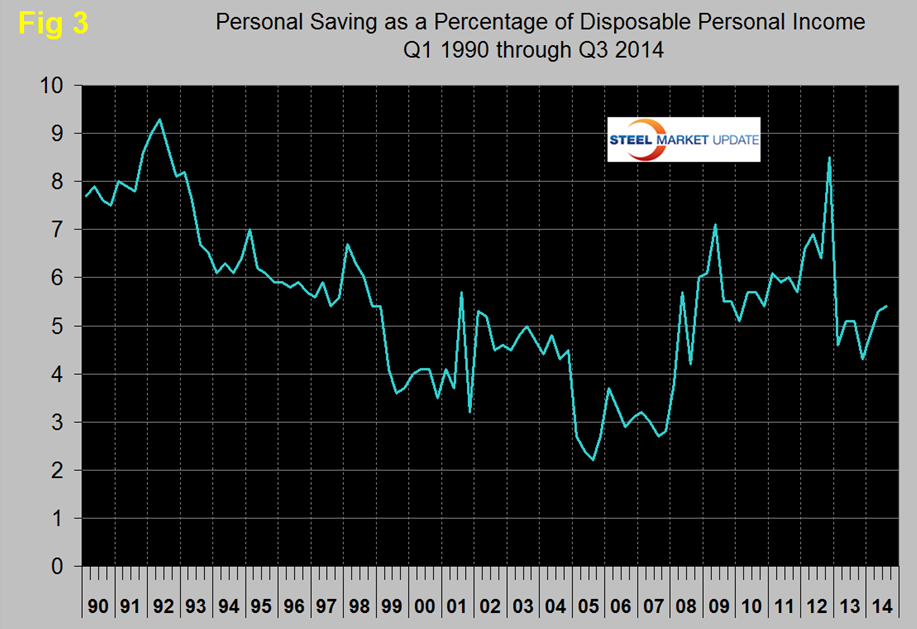
Consumer savings as a percentage of disposable personal income in 2013 and 2014 have returned to the level that pertained in the early 2000s, (Figure 3). Ultimately savings are invested which drives productivity, GDP and steel consumption.
The structure of the increasing debt level is not of much help to steel providers in terms of increased consumption and it appears to us at SMU that the student loan situation is already at an unsustainable level and could precipitate the next taxpayer bailout and financial crisis.


