

Market Data

February 25, 2015
Producer Price Indexes of Sheet Steel, Aluminum, Plastic and Transportation - January 2015
Written by Peter Wright
Each month the Bureau of Labor Statistics, (BLS) puts out its series of producer price indexes, for thousands of goods and materials. For an explanation of this program see the end of this piece. The latest release last Wednesday reported January results. We run this analysis every three months to give readers an opportunity to become aware of any changes in the competitive position of steel against other materials and rail vs truck transportation.
![]() The PPI data are helpful in monitoring the price direction of steel and steel products against competing materials and products. As far as we at SMU can tell from comparison with known transaction prices, these PPI are a good representation of the real world. However our observation is that the actual values of the PPIs of different products cannot be compared with one another because they are developed by different committees within the BLS. We believe that this data is useful only in comparing the direction of prices in the short and medium term.
The PPI data are helpful in monitoring the price direction of steel and steel products against competing materials and products. As far as we at SMU can tell from comparison with known transaction prices, these PPI are a good representation of the real world. However our observation is that the actual values of the PPIs of different products cannot be compared with one another because they are developed by different committees within the BLS. We believe that this data is useful only in comparing the direction of prices in the short and medium term.
The January report from the BLS began as follows; The Producer Price Index for final demand decreased 0.8 percent in January, seasonally adjusted. Final demand prices moved down 0.2 percent in both December and November. On an unadjusted basis, the index for final demand was unchanged for the 12 months ended in January. In January, the 0.8-percent decline in final demand prices can be traced primarily to a 2.1-percent decrease in the index for final demand goods. Prices for final demand services fell 0.2 percent.
Final demand goods: The index for final demand goods moved down 2.1 percent in January, the seventh consecutive decrease. Leading the broad-based decline in January, prices for final demand energy fell 10.3 percent. The indexes for final demand foods and for final demand goods less foods and energy moved down 1.1 percent and 0.2 percent, respectively.
Product detail: The decline in prices for final demand goods was led by the index for gasoline, which dropped 24.0 percent. Prices for diesel fuel, jet fuel, basic organic chemicals, dairy products, and home heating oil also moved lower. Conversely, the index for residential electric power moved up 1.2 percent. Prices for pharmaceutical preparations and for fresh and dry vegetables also advanced.
Final demand services: The index for final demand services decreased 0.2 percent in January, the first decline since falling 0.3 percent in September 2014. In January, prices for final demand services less trade, transportation, and warehousing moved down 0.4 percent, and the index for final demand transportation and warehousing services dropped 0.8 percent. In contrast, margins for final demand trade services advanced 0.5 percent. (Trade indexes measure changes in margins received by wholesalers and retailers.)
For the purpose of this report, SMU has extracted comparative statistics for sheet steel, aluminum and plastic products and truck and rail transportation. Table 1 is a summary of each category on a year over one, two and three year basis.
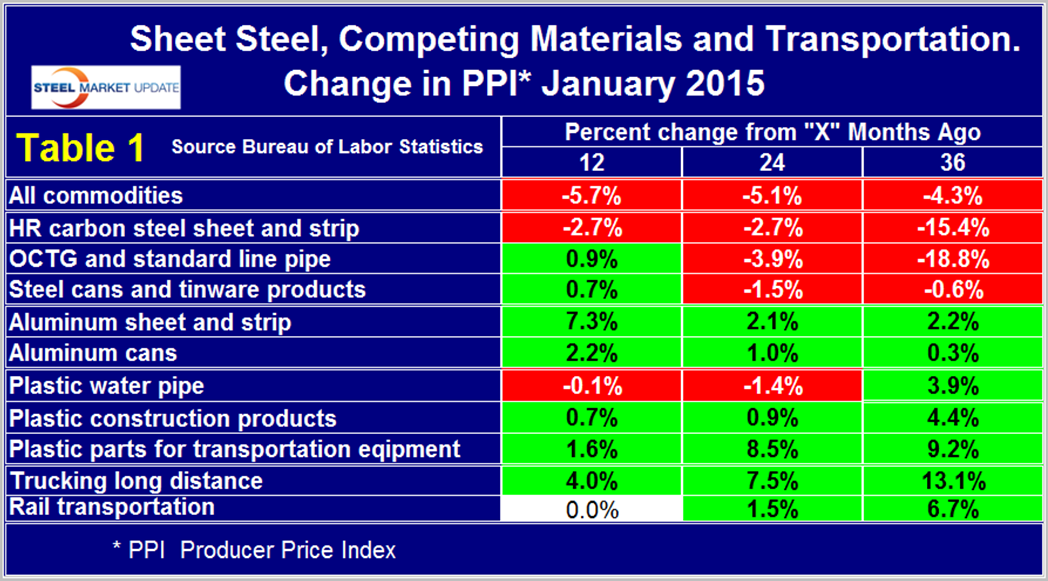
Our analysis of the PPI data shows that commodity prices declined by 5.7 percent in 12 months through January and were also down on a two and three year comparison. In fact commodity prices were back to where they were four years ago in January 2011. A rising $ will put downward pressure on commodity prices and the demand side of the equation is exacerbating currency effects at this time. Of particular interest in this analysis is the huge surge in the PPI of aluminum sheet and strip. Steel sheet has had a 10 percent improvement in competitiveness in the last 12 months against aluminum. Steel cans have experienced a 1.5 percent PPI improvement against aluminum cans in the last 12 months. In our last report in November we noted that plastic water pipe had surged in the previous twelve months but we expected this to go into reverse when the current oil price collapse percolated through the supply chain. This has now begun to happen and the PPI of plastic piping is declining. The International Energy Agency reported on November 14th, (and we think this is still relevant) that “A rout in oil prices is likely to continue into the first half of 2015 unless global output is reduced. Crude prices have collapsed since June to the lowest level since early 2009 driven by sluggish demand growth and a surplus of supply resulting from booming production in North America. Though the IEA expects demand growth to pick up throughout 2015 after falling to its weakest level in five years in 2014, it forecasts demand will fall steeply at the start of 2015 compared to the end of 2014. Meanwhile, robust oil supply shows no sign of abating.
Table 1 also shows price changes for truck and rail transportation and indicates that highway delivery has lost ground to rail in the last 12, 24 and 36 month periods.
The official description from the Bureau of Labor Statistics, (BLS) reads as follows. The Producer Price Index (PPI) is a family of indexes that measure the average change over time in the prices received by domestic producers of goods and services. PPIs measure price change from the perspective of the seller. This contrasts with other measures, such as the Consumer Price Index (CPI). CPIs measure price change from the purchaser’s perspective. Sellers’ and purchasers’ prices can differ due to government subsidies, sales and excise taxes, and distribution costs. More than 9,000 PPIs for individual products and groups of products are released each month. PPIs are available for the products of virtually every industry in the mining and manufacturing sectors of the U.S. economy. New PPIs are gradually being introduced for the products of industries in the construction, trade, finance, and services sectors of the economy. More than 100,000 price quotations per month are organized into three sets of PPIs: (1) Stage-of-processing indexes, (2) commodity indexes, and (3) indexes for the net output of industries and their products. The stage-of processing structure organizes products by class of buyer and degree of fabrication. The commodity structure organizes products by similarity of end use or material composition. The entire output of various industries is sampled to derive price indexes for the net output of industries and their products.


