

Market Data

June 1, 2015
Currency Update for Steel Trading Nations
Written by Peter Wright
The dollar is making another strong move upward. The Fed reports a daily nominal (non-inflation adjusted) index, the latest data for which is May 22nd with a value of 114.62 up 1.6 percent in 7 days. On March 13th the daily index peaked at 117.92, the highest value since May 13th 2004. Figure 1 shows the history of the daily BI since January 2011.
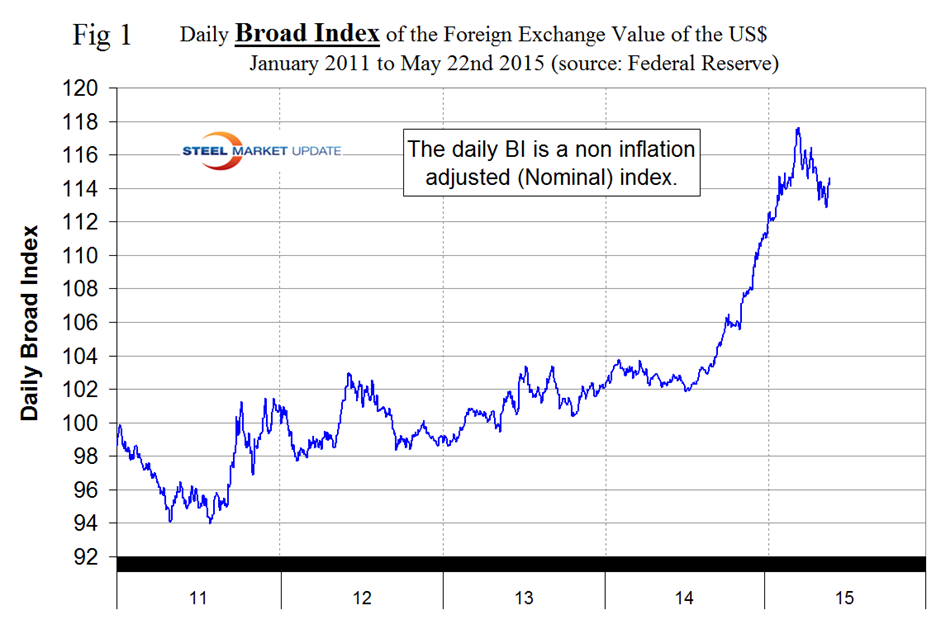
We normally prefer to show a longer time frame than this but doing so at present would lose the dramatic short term detail. After March 13th the nominal daily index declined to 112.84 on May 15th before recovering in the last 7 days. For the purpose of this report we use daily currency data for the steel trading nations obtained from the Oanda Forex trading platform which is described at the end of this report. Oanda data is current as of today’s date and the surge in the value of the dollar continued last week. It does not necessarily follow that the currencies of the steel trading nations follow the Broad Index but recently they seem to be doing so. Table 1 shows the number of currency units of steel trading nations that it takes to buy one US dollar and the change in one year, three months, one month and seven days.
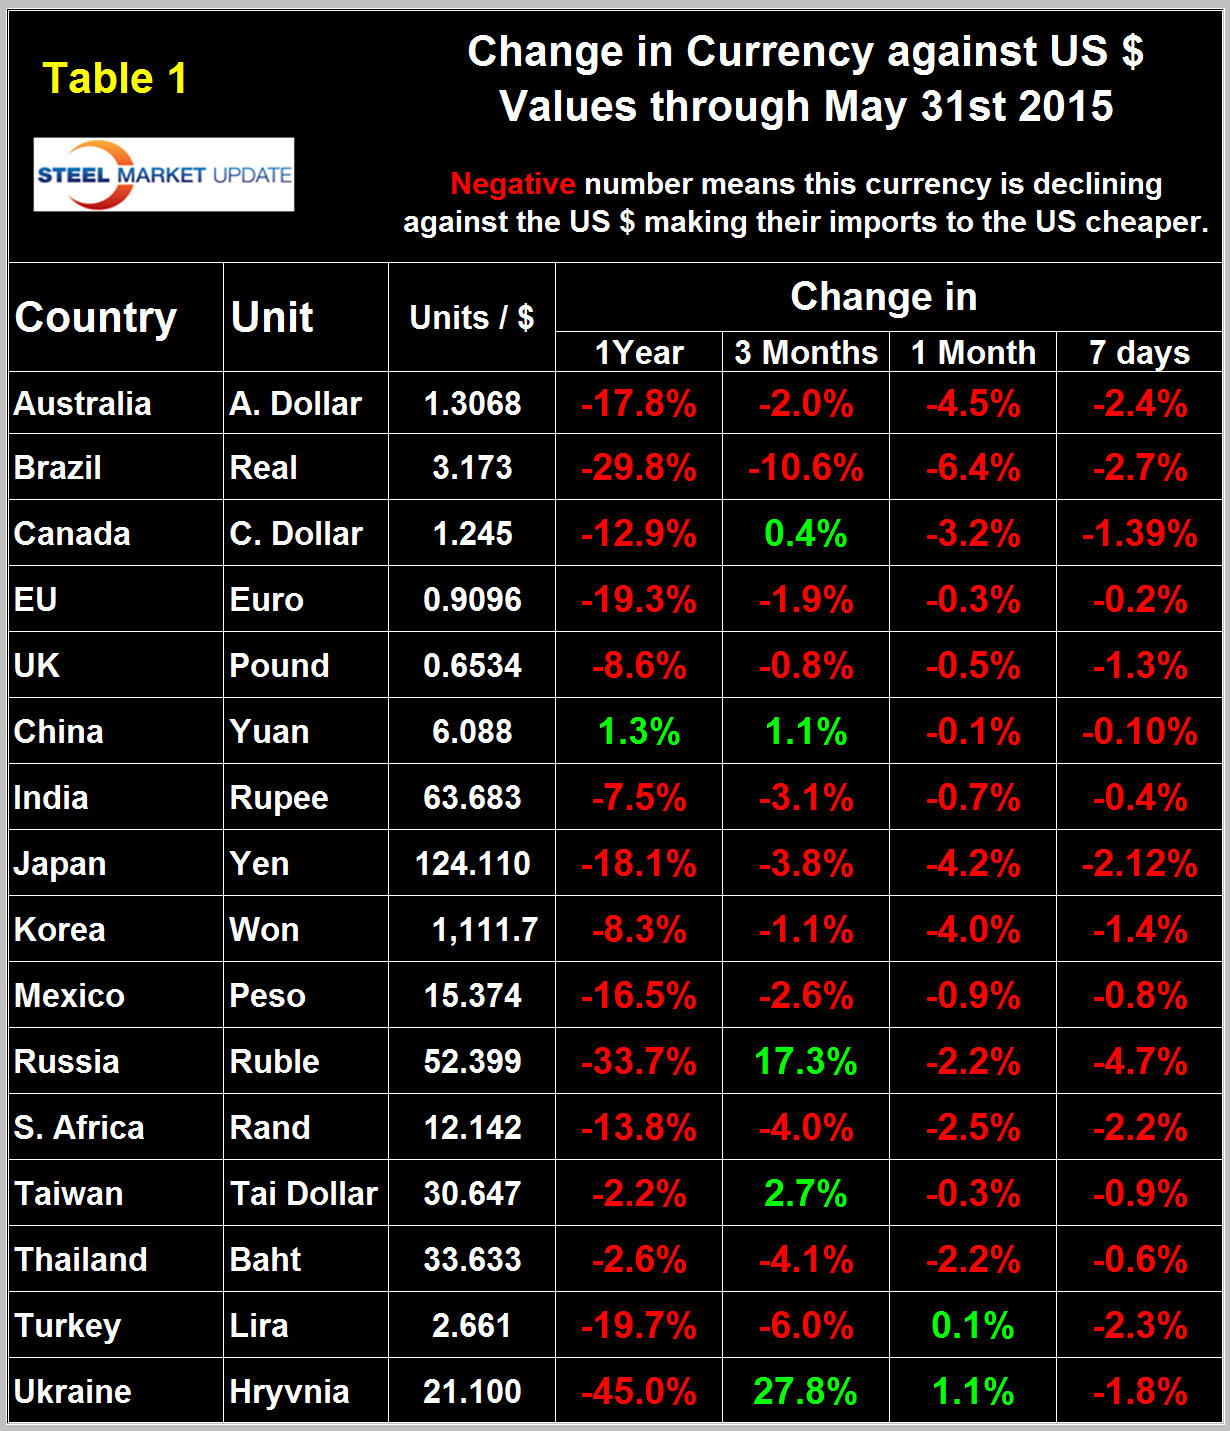
The table is color coded to indicate strengthening of the dollar in red and weakening in green. We regard strengthening of the US Dollar as negative and weakening as positive because the effect on net imports. In 2014, 25 percent of the U.S. economy was related to international trade therefore currency swings can have a huge effects on the economy in general and of the steel industry in particular. The 2nd estimate of GDP growth in the second quarter was released on Friday with a negative 0.7 percent result, however the contribution of net exports was negative 1.9 percent (Figure 2).
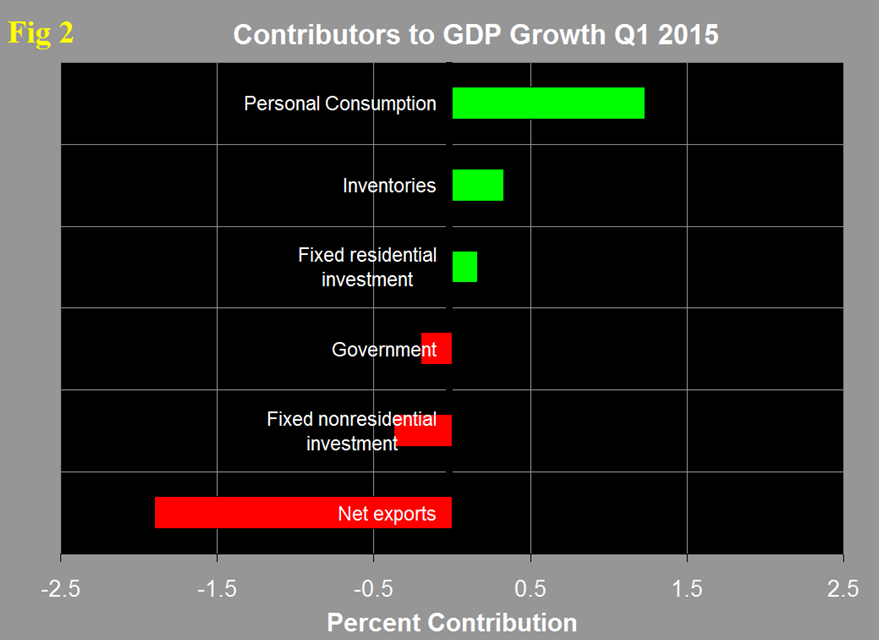
This was the most pronounced drag on the economy since before the recession. To dramatize the change in currency direction for the steel trading nations we have included here the currency table that we published on April 17th, just six weeks ago which was the peak of the most recent wave of ‘Green’ (Table 1 from April 17th.)
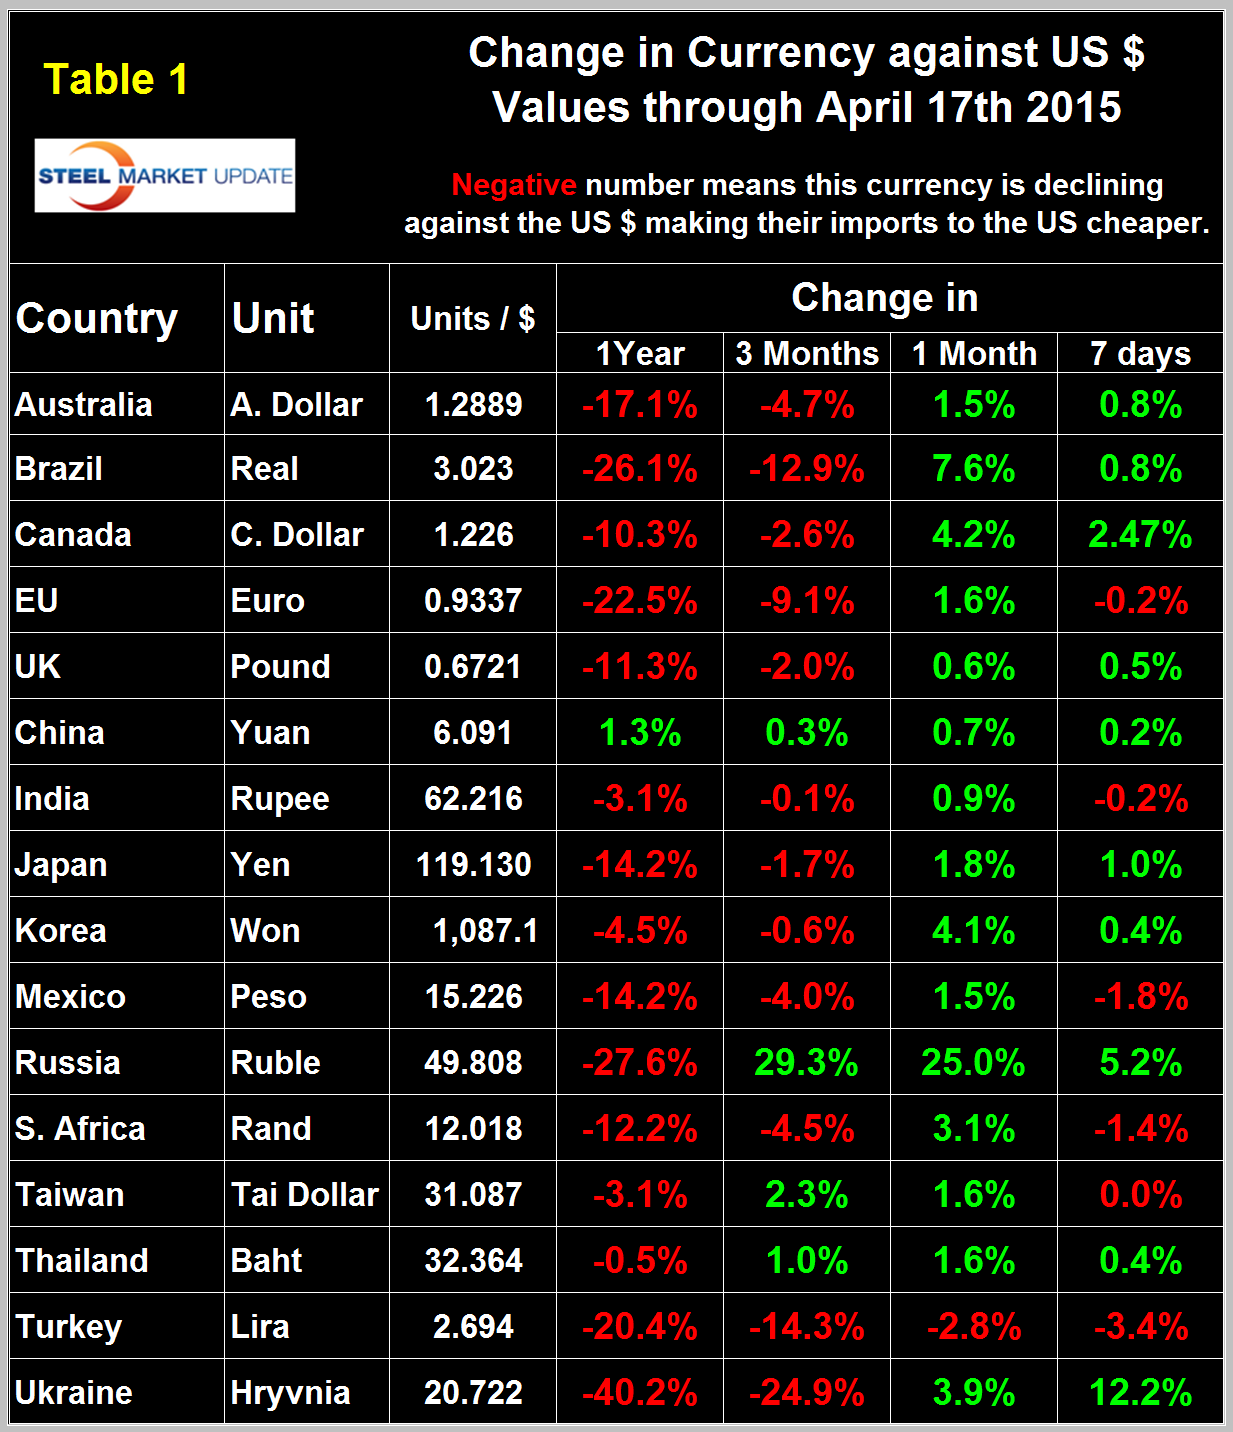
On February 14th, only 3 of the 16 currencies listed were green in the one month column, this rose to 15 on April 17th meaning that the dollar had weakened against all but one of the steel trading currencies. In this latest analysis the number of greens has fallen to 2 in the one month column and 1 in the seven day column.
On Friday the US 10 year treasury yield was 2.12 percent (Figure 3) which doesn’t look like much of a magnet to draw in overseas investment but half of all government bonds in the world today yield less than 1 percent.
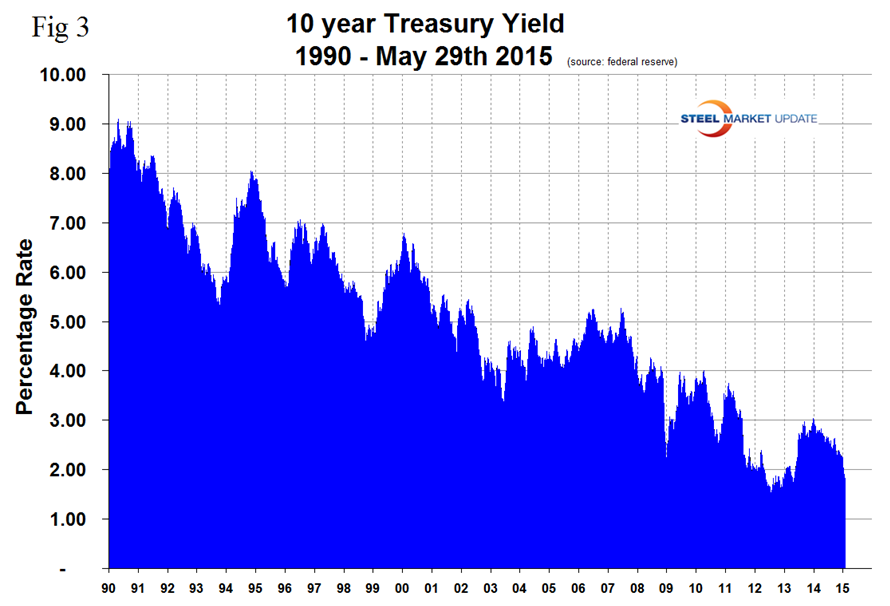
Negative-yield bonds now account for some €1.5 trillion of debt issued by governments in the euro area, equivalent to almost 30 percent of the total outstanding. Many expect even more of the global bond market to fall into negative yield territory, and considering that the Fed is expected to increase interest rates in the US sometime this year the dollar looks likely to continue to strengthen.
At SMU we continue to regard the saga of the Euro as having the most significant future impact on the US steel industry. On September 6th last year the Euro broke through the 1.3 US $/Euro level for the first time since July 11th 2013, on January 6th it broke through 1.20 and through 1.10 on March 7th. It then strengthened to 1.1452 on May 18th and has since slid back to 1.0994 (Figure 4).
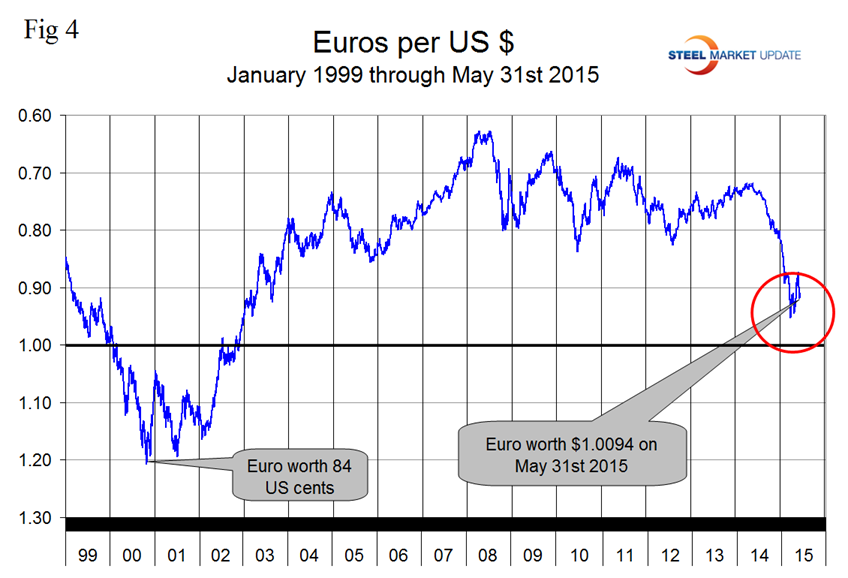
On May 25th Benoît Cœuré, a member of the Executive Board of the European Central Bank, made a big splash when he announced that the ECB would adjust its schedule for quantitative easing (QE) due to seasonal factors. Even though neither the average monthly amount of QE (€60 billion) nor the presumed target end date of QE changed, the announced frontloading and potential back-loading to avoid poor summer liquidity surprised the market enough to depress the Euro. A devalued Euro means that US exports will be more expensive in Europe and European imports will be cheaper here. This is particularly true for steel trade. In addition European scrap will be more attractive to Turkish buyers than supplies from the US which will put downward pressure on domestic scrap prices. We don’t believe the Euro zone can exist indefinitely in its present form considering the differences in unit labor costs and the trade imbalances between the north and south.
The Russian Ruble strengthened to less than 50 to the dollar on May 14th but has since slid back to 52.399 on the 31st. The Ruble had declined to slightly less than 70 to the US $ on February 1st (Figure 5).
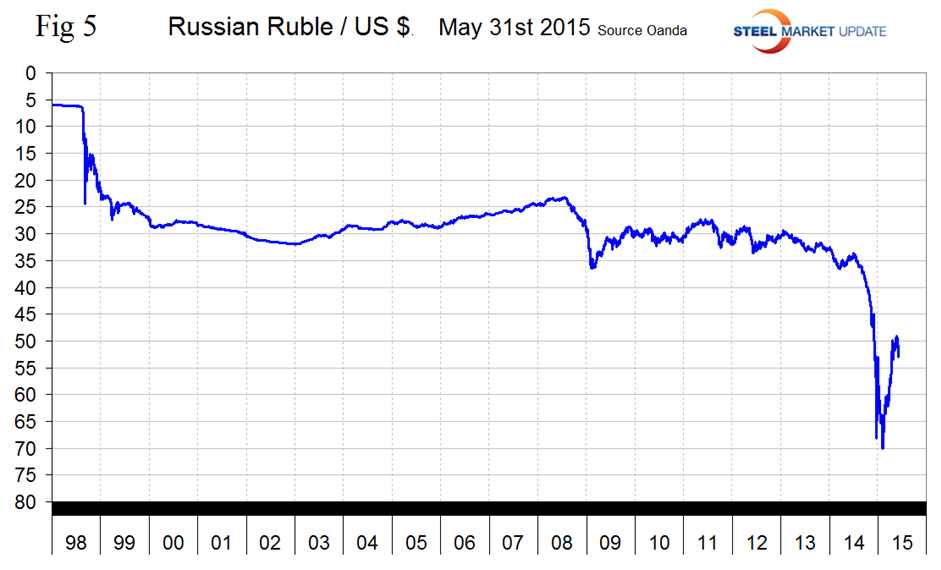
As it stands now the Ruble has declined by 33.7 percent against the dollar in 12 months but in the last three months has recovered by 17.3 percent. In the last month and 7 days the Ruble declined by 2.2 percent and 4.7 percent respectively.
The Japanese Yen broke through the 120 level on December 6th and traded more or less sideways until ten days ago when it resumed its decline, closing at 124.11 on May 31st (Figure 6).
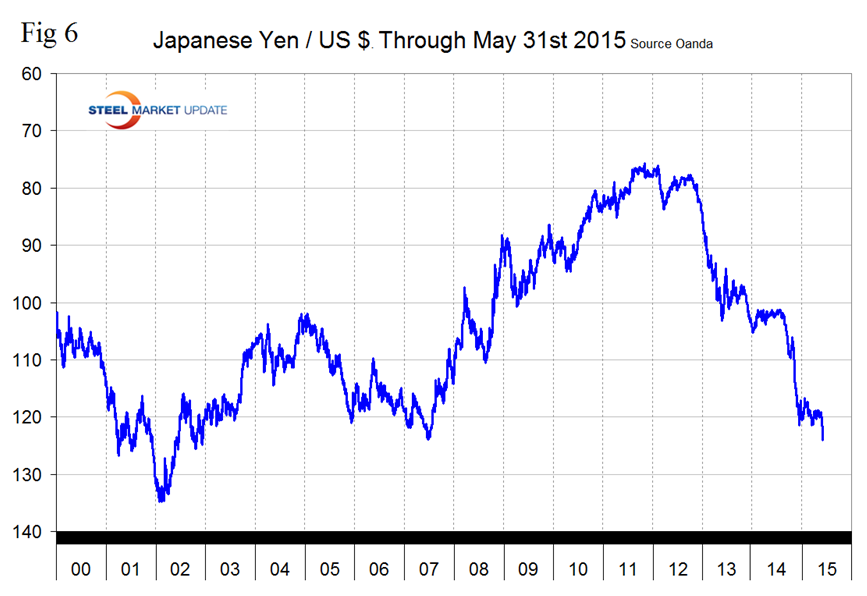
Depreciation against the dollar has been 18.1 percent in 12 months, by 4.2 percent in one month and by 2.1 percent in 7 days. In May, the Bank of Japan chose to hold interest rates unchanged as there was a divergence between household spending and export data. The lending rate came in at 0 percent, unchanged from the previous meeting, and in line with estimates. Policymakers stated the economy was growing moderately, leading them to hold off on further easing. Japan’s economy remains in a mixed state of recovery and failure. Economic activity is being weighed down by falling consumer spending, while foreign trade is steadily improving. Policymakers are unlikely to raise rates in the near future as inflation remains low, with a bias being towards easing further over the coming year, which should continue to weigh on the strength of the Yen.
The Chinese Yuan closed at 6.088 on May 31st which was exactly its value in our last update of May 9th (Figure 7).
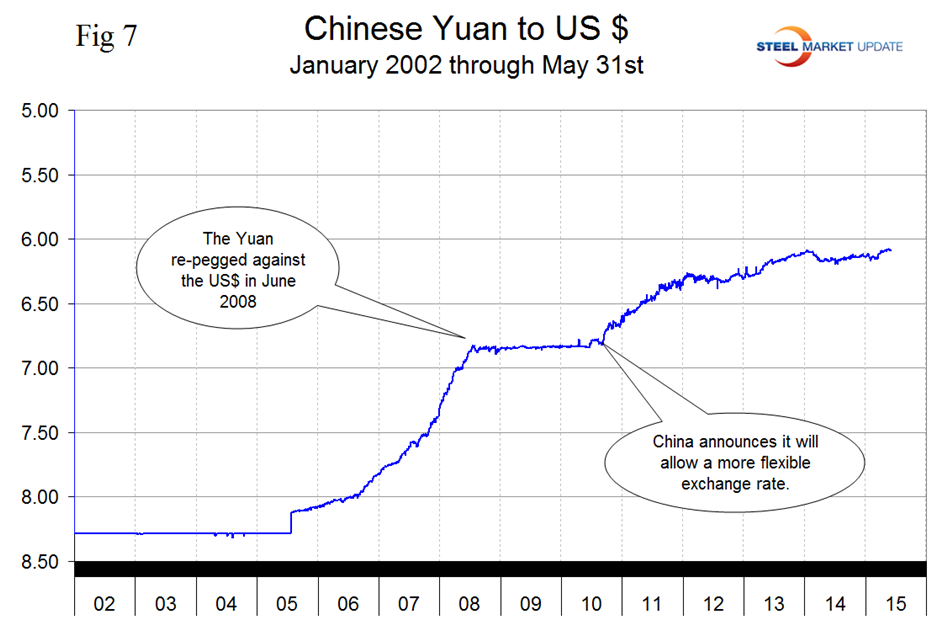
Whenever the exchange rate fluctuates too much, the central bank of China intervenes in the markets to bring the rate back to where it wants it to be. Managing the exchange rate this way has helped China to compete in global export markets and accumulate trillions of dollars’ worth of foreign exchange reserves. The IMF which only a few months ago was still berating China for undervaluing its currency, reversed its position last week. IMF Consultation Mission to China Press Release No. 15/237 May 26, 2015: “In recent years, China has played an increasingly important role in driving global growth, contributing to global economic and financial stability, and helping to improve the international monetary system. As part of the ongoing review of the Special Drawing Rights (SDR) basket at the IMF, the Chinese authorities have stated publicly their interest in including the Renminbi in the SDR basket. We welcome and share this objective and will work closely with the Chinese authorities in this regard. As the Managing Director of the IMF has said, RMB inclusion is not a matter of ‘if’ but ‘when’. While undervaluation of the Renminbi was a major factor causing the large imbalances in the past, our assessment now is that the substantial real effective appreciation over the past year has brought the exchange rate to a level that is no longer undervalued. However, the still-too-strong external position highlights the need for other policy reforms. This will require that the exchange rate adjusts with changes in fundamentals and, for example, appreciates in line with faster productivity growth in China (relative to its trading partners). On the exchange rate system, we urge the authorities to make rapid progress toward greater exchange rate flexibility, a key requirement for a large economy like China’s that strives for market-based pricing and is integrating rapidly in global financial markets. We believe that China should aim to achieve an effectively floating exchange rate within 2–3 years.” According to the Society for Worldwide Financial Telecommunications, the yuan moved back into fifth place in market share in global payments in March, after dropping to seventh place in February. The four currencies far ahead of it are the U.S. dollar, British pound, euro and Japanese yen. The yuan only accounts for a little over 2 percent of global transactions as of this writing.
The Brazilian Real recovered to 2.91 to the US $ on April 29th but has since sunk back to 3.1733 (Figure 8).
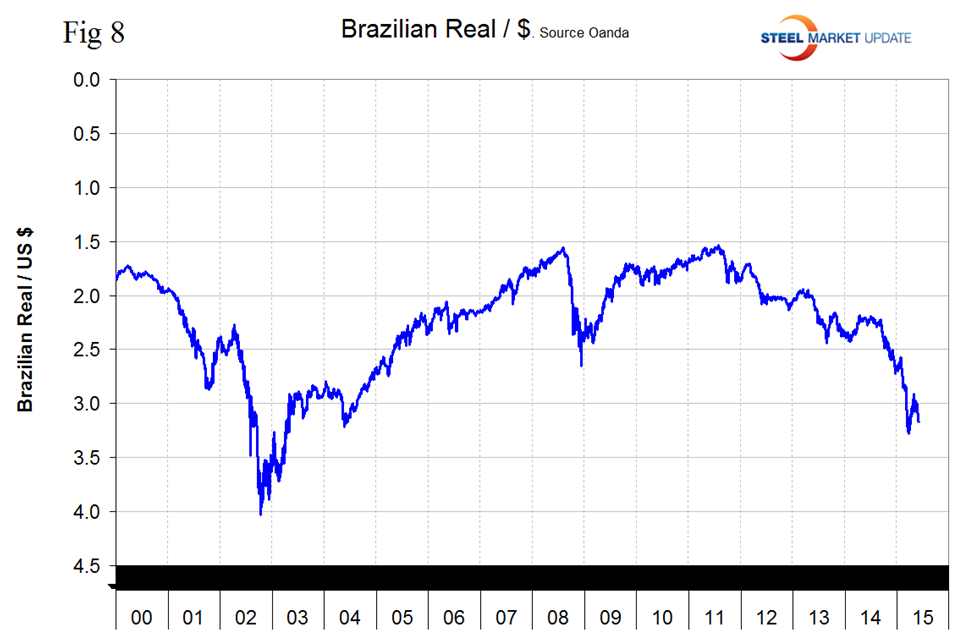
The Real is down by 29.8 percent in 12 months and by 2.7 percent in the last 7 days. From Armada on May 22nd; the strong dollar threatens to do immense damage to the economy as so many of Brazil’s loans are dollar denominated and that makes servicing them that much harder as the Real deteriorates. Rising inflation has forced policymakers to raise lending rates, weighing on economic activity and business sentiment. In May, the inflation figure came in at an annual pace of 8.24 percent, since the start of 2014, inflation has risen from 6 percent annual inflation to current levels. As inflation rose, consumer purchasing power took a major hit. The economy is slowing as austerity measures force lending rates higher. With Brazil’s economy contracting, continued selling of its currency on the global market should take place, weighing on the strength of the Real over coming months.
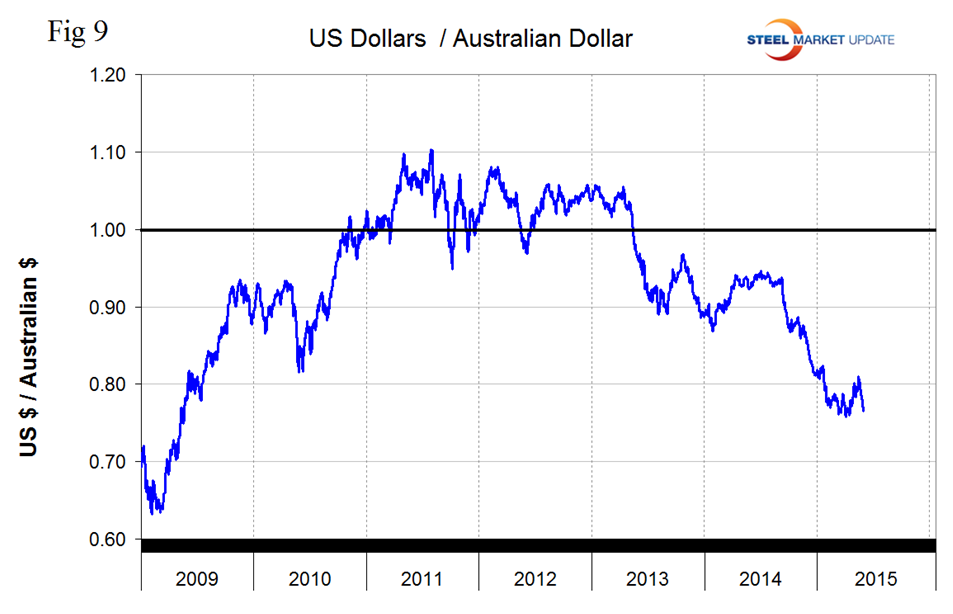
The Australian dollar recovered to 81 US cents on May 15th but has since declined to 76.5 cents. The A$ is down by 17.8 percent in 12 months, by 4.5 percent in one month and by 2.4 percent in 7 days (Figure 9).
SMU Comment: In this analysis we report on the currencies that we think have the most immediate significance, but all 16 steel trading nation graphs are available on request if any reader has a special interest that we haven’t covered. The appreciation of the dollar seems to have resumed with a vengeance which is not good for US steel producer competitiveness. The currency trends will continue to attract imports and suppress both exports and raw materials prices.
Explanation of Data Sources: The broad index is published by the Federal Reserve on both a daily and monthly basis. It is a weighted average of the foreign exchange values of the U.S. dollar against the currencies of a large group of major U.S. trading partners. The index weights, which change over time, are derived from U.S. export shares and from U.S. and foreign import shares. The data are noon buying rates in New York for cable transfers payable in the listed currencies. At SMU we use the historical exchange rates published in the Oanda Forex trading platform to track the currency value of the US $ against that of sixteen steel trading nations. Oanda operates within the guidelines of six major regulatory authorities around the world and provides access to over 70 currency pairs. Approximately $4 trillion US $ are traded every day on foreign exchange markets.


