Analysis

June 22, 2015
Total NAFTA Light Vehicle Production in May at 17.665 Million Annualized Rate
Written by John Packard
Light vehicle sales in the US skyrocketed in May to a seasonally adjusted annualized rate of 17.8 million units. This is the strongest pace in almost 10 years. Auto sales were 7.4 million in April and rose to 8.1 million in May. Light trucks rose from 9.1 to 9.7 million. Imports in May were 3.8 million and domestic 14.0 million. Year-to-date sales averaging 16.9 million units are in line with the expectations for the full year.
Driving forces behind the strong demand are steadily improving employment and wages and improved financing terms. Ford has announced its intention to shorten its annual two-week summer shutdown to one week (at five of its North American plants) and FCA has canceled its usual seasonal shutdown at four factories in the US and Mexico.
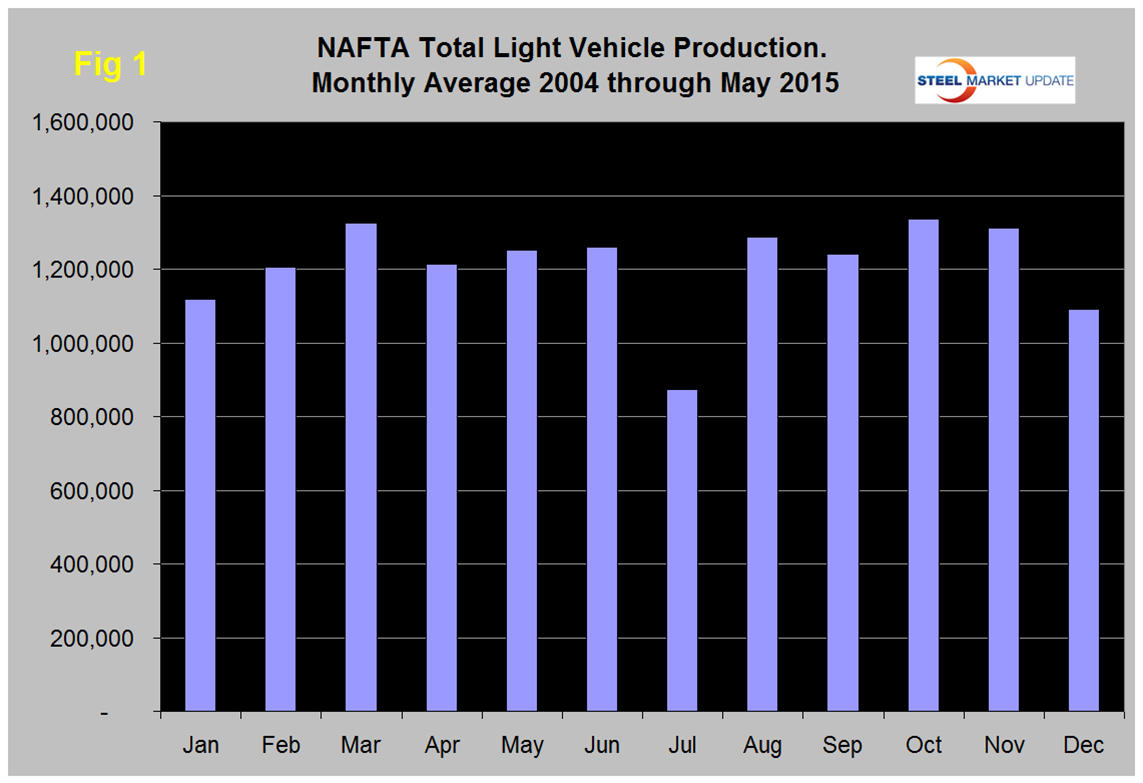
Total light vehicle (LV) production in NAFTA in May was at an annual rate of 17.655 million units, down from 17.905 in April. On average since 2004, May’s production has been 3.2 higher than April, this year May was down by 1.0 percent, (Figure 1). Note: these production numbers are not seasonally adjusted, the sales data reported above are seasonally adjusted. History predicts that production will increase by 0.8 percent in June.
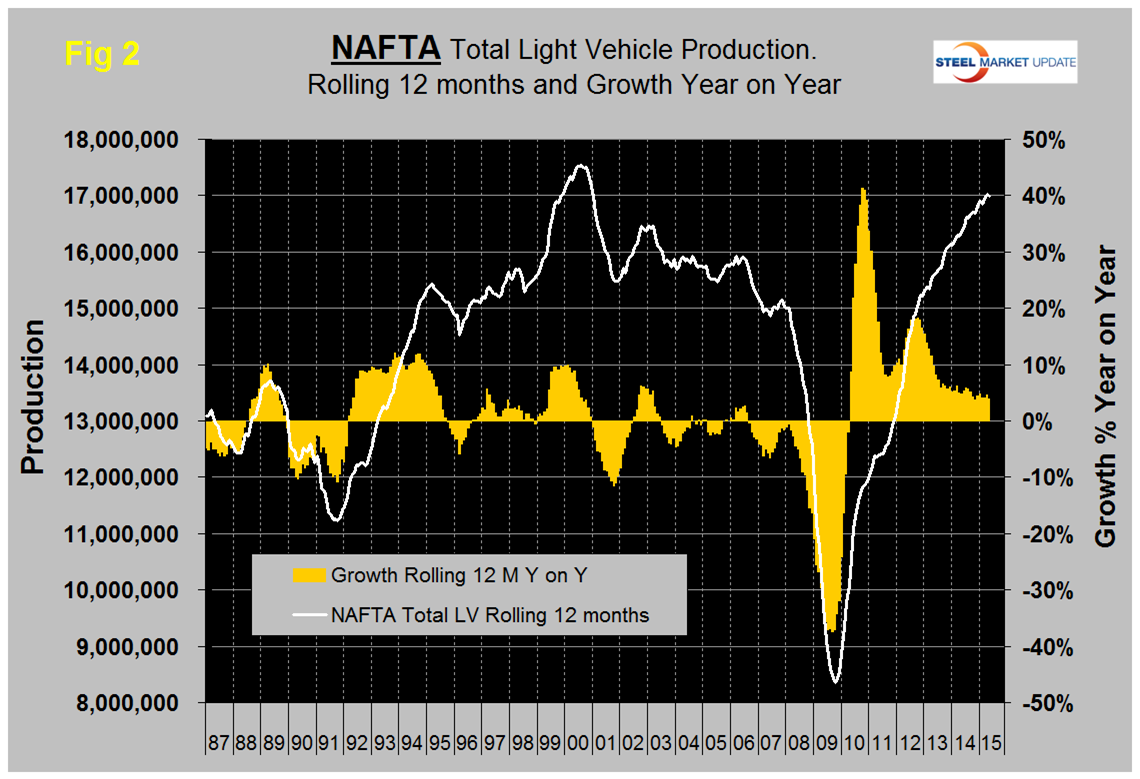
On a rolling 12 months basis y/y LV production in NAFTA increased by 3.9 percent through May. LV production in NAFTA is now well above the pre-recession peak of Q2 2006 and is heading for the all-time high of mid-2000, (Figure 2).
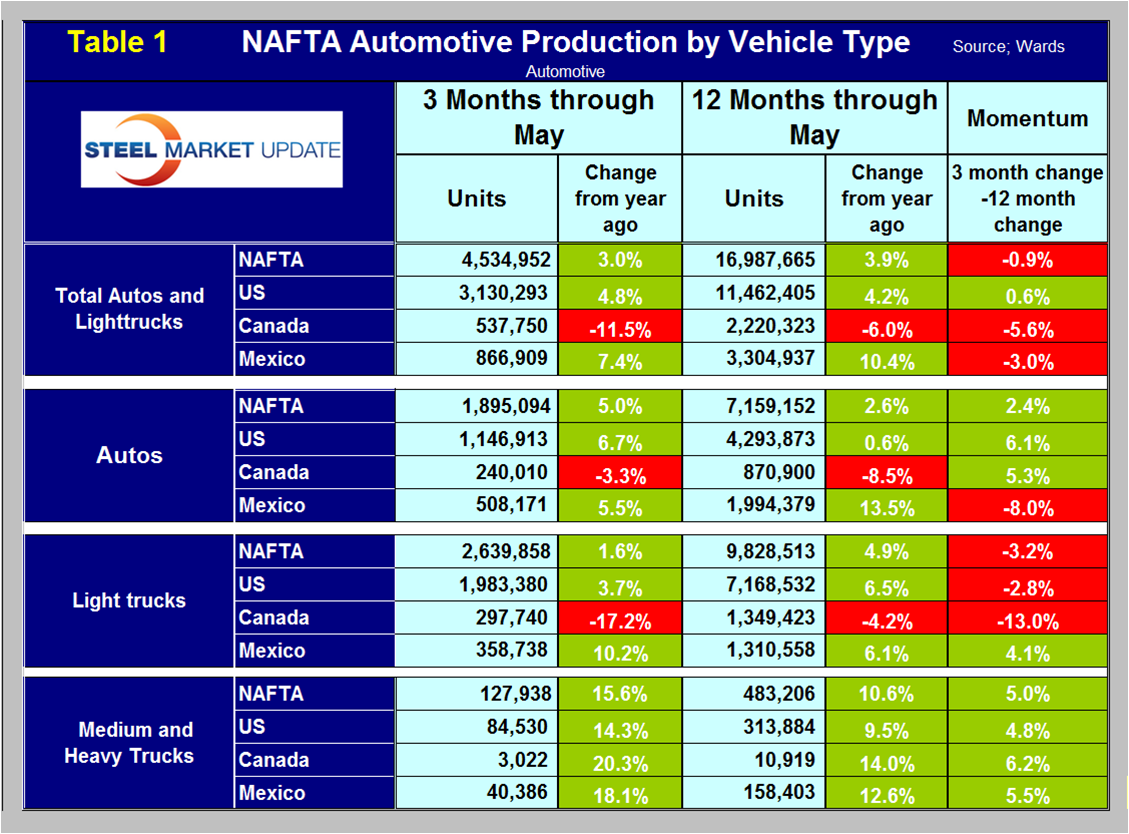
On a rolling 12 months basis y/y the US is up by 4.2 percent, Canada is down by 6.0 percent and Mexico is up by 10.4 percent, (Table 1).
The US has gained production share in the most recent 3 ½ years, (Figure 3) and so far in 2015 that gain has accelerated at the expense of Canada. In May on a rolling three month basis, the US production share at 69 percent was the highest since March 2008.
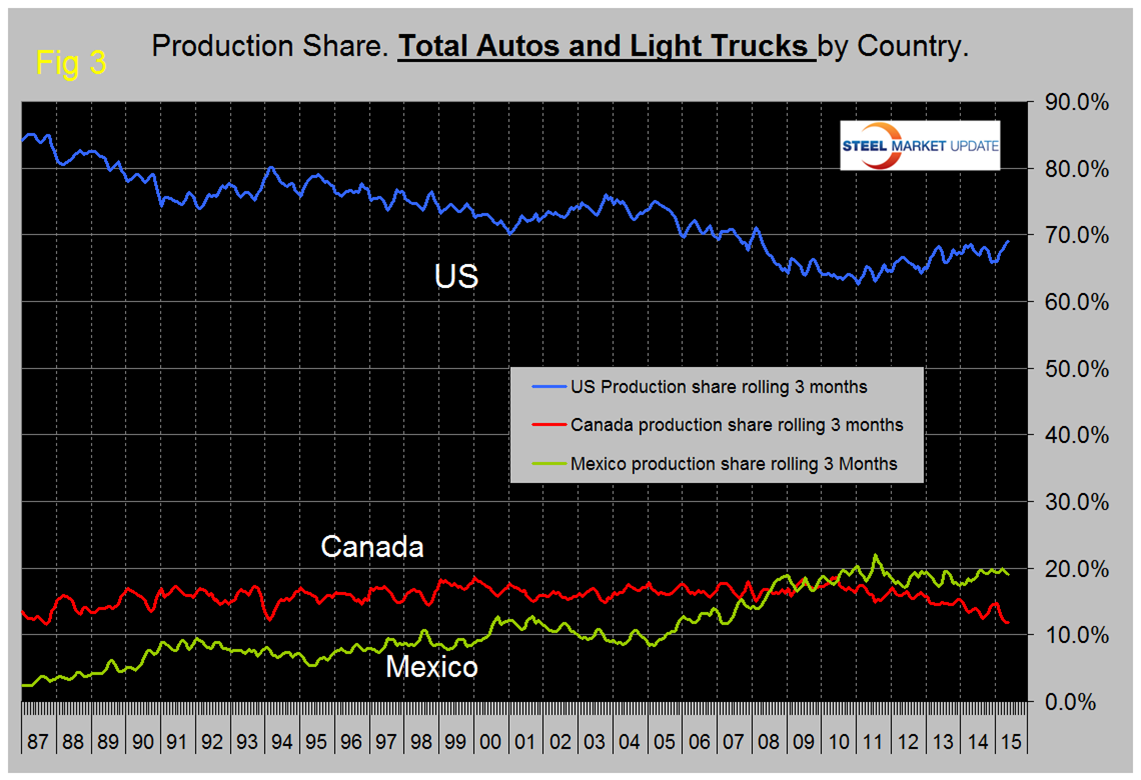
Figure 4, Figure 5 and Figure 6 show total LV production by country with y/y growth rates and on each the red line shows the change in production since Q2 2006. Note the scales are the same to give true comparability and that Mexican growth is surging at twice the rate in the US and Canada continues to contract.
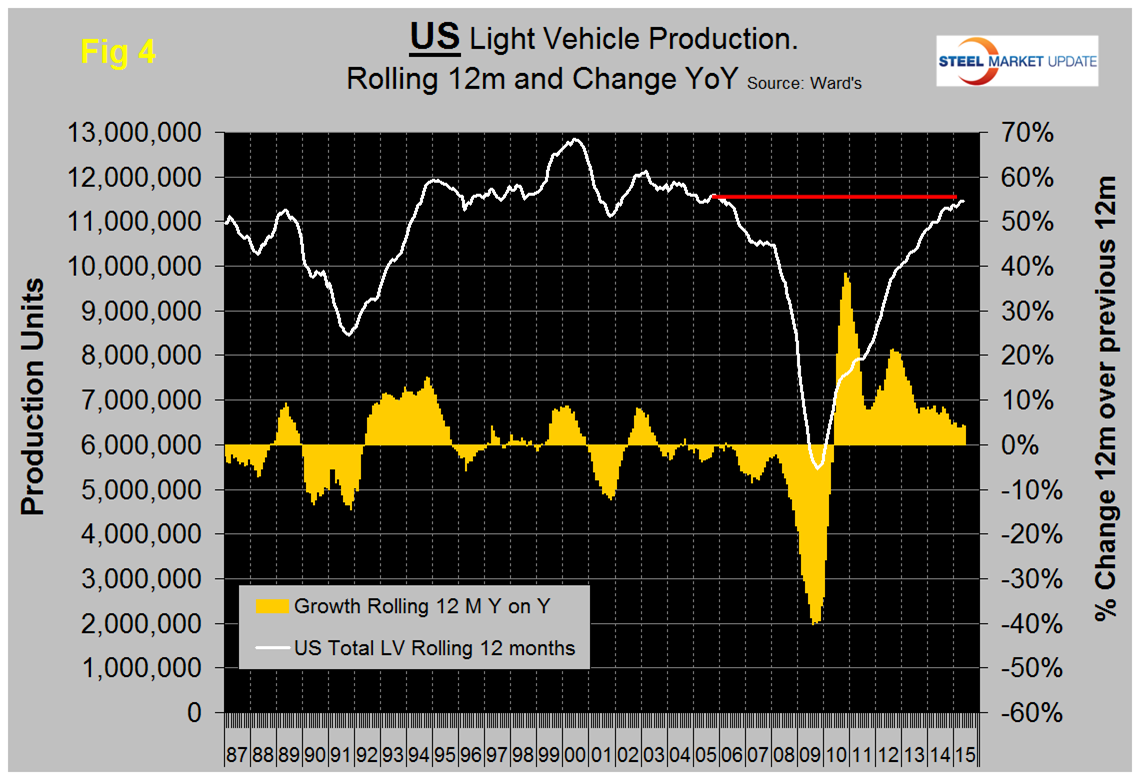
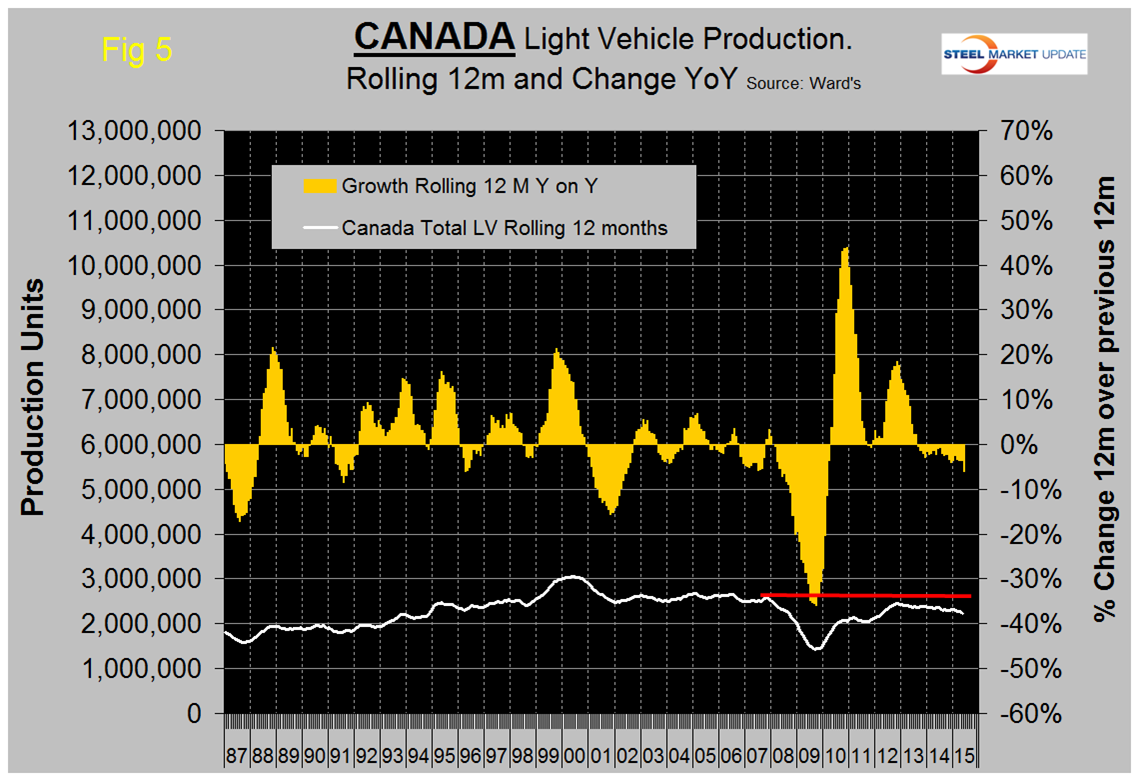
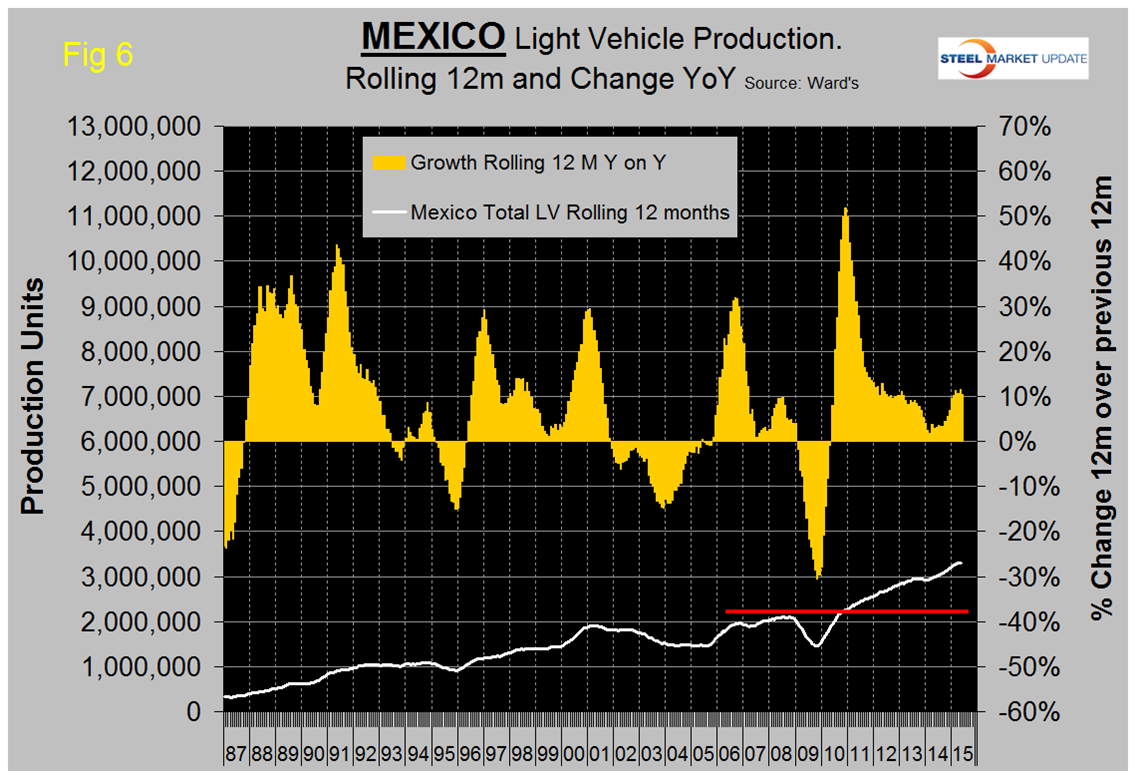
The decline of both the Canadian dollar and the Mexican Peso must be causing auto assemblers to look at moving production, to Mexico in particular. We believe there is spare capacity both sides of both borders for the automotive manufacturers to play this game. This isn’t happening so much in Canada, in spite of the depreciation of the Loonie, because (in our opinion) the labor relations situation in Canada is causing manufacturers in general to reduce their exposure. US steel is a case in point.
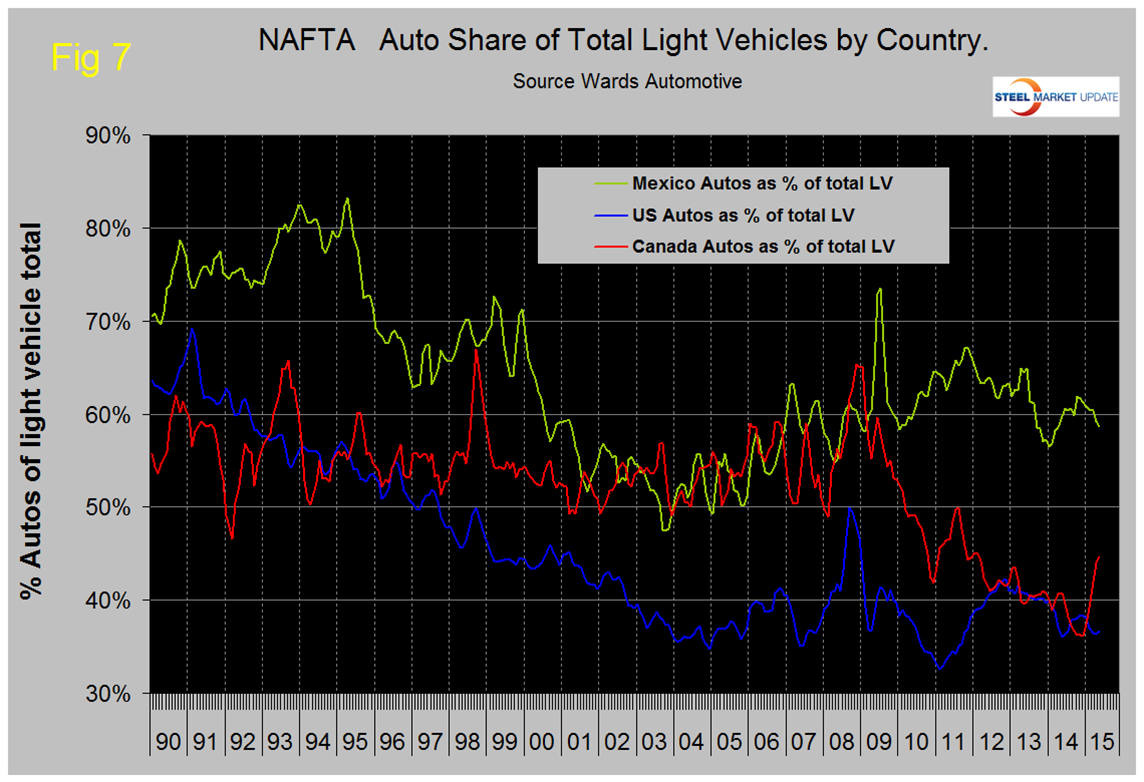
The mix of light vehicles is very different by country, (Figure 7). The percentage of autos in the Mexican mix in the last three months was 58.6 percent but only 36.6 in the US and 44.6 percent in Canada.
Ward’s Automotive reported on Wednesday that total light vehicle inventories in the US decreased by 9 days of sales from 65 at the end of April to 56 at the end of May, 4 days lower than the end of May last year. Month over month FCA (Fiat Chrysler Automotive) was down by 8 days to 70, Ford down by 11 days to 61 and GM was down 9 days to 63.
The SMU data file contains more detail than be shown here in this condensed report. Readers can obtain copies of additional time based performance results on request if they wish to dig deeper. Available are graphs of auto, light truck and medium and heavy truck production, growth rate and production share by country.