

Market Data

June 24, 2015
Gross Domestic Product for Q1 2015, Third Estimate
Written by Peter Wright
The Bureau of Economic Analysis (BEA) released the third estimate of Q1 2015 Annual Revision of the National Income and Product Accounts on Wednesday.
The annualized growth rate in the third estimate was -0.17 percent down from Q4 2014 which came in at 2.2 percent. GDP is measured and reported in chained 2009 dollars and in Q1 was estimated to be $16.288 trillion. The calculation is slightly misleading because it takes the Q over Q growth and multiplies by 4 to get an annualized rate. This makes the high quarters higher and the low quarters lower. Figure 1 clearly shows this effect.
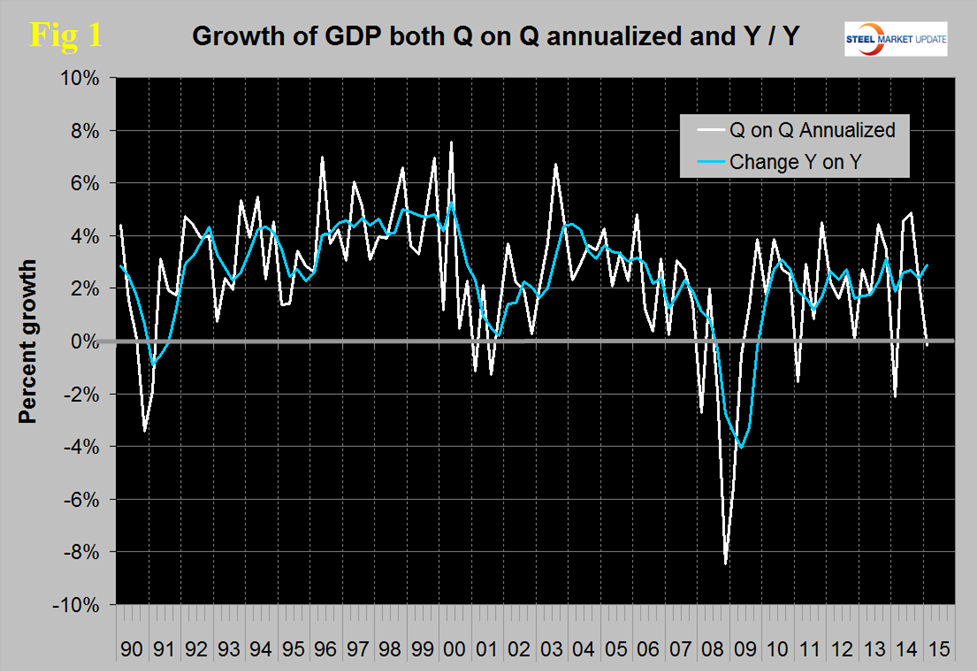
The blue line is the trailing 12 months growth and the white line is the headline quarterly result. On a year over year basis GDP was 2.88 percent higher in the first quarter than it was in Q1 2014 and that result is in line with performance since mid-2010. The BEA have been criticized for the way they do seasonal analysis which has tended to penalize the first quarter. At the end of July a revised calculation will be introduced retrospectively.
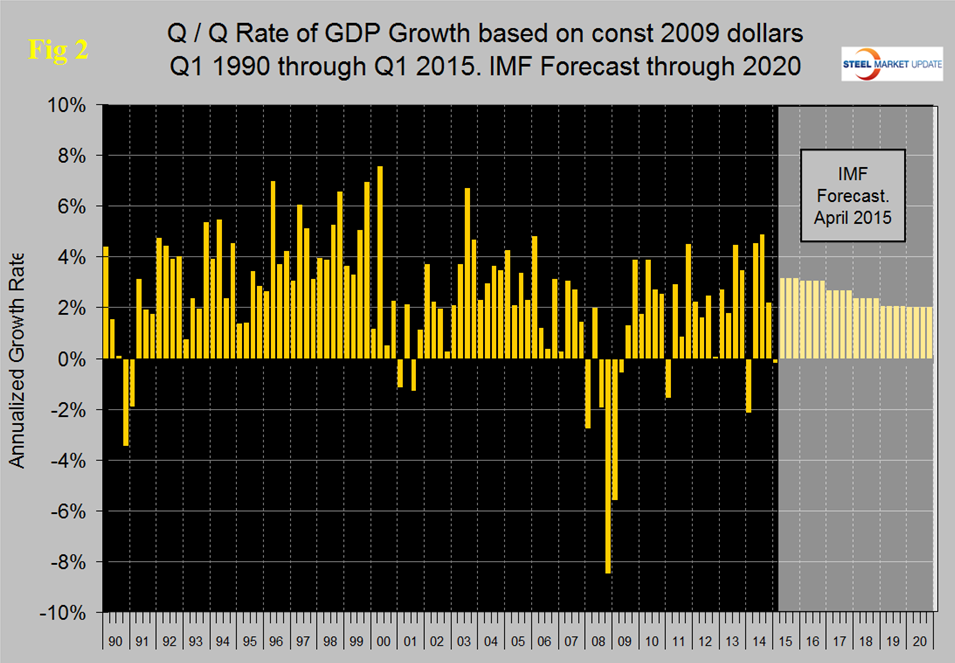
Figure 2 shows the headline quarterly results since 1990 and the latest IMF forecast through 2020.
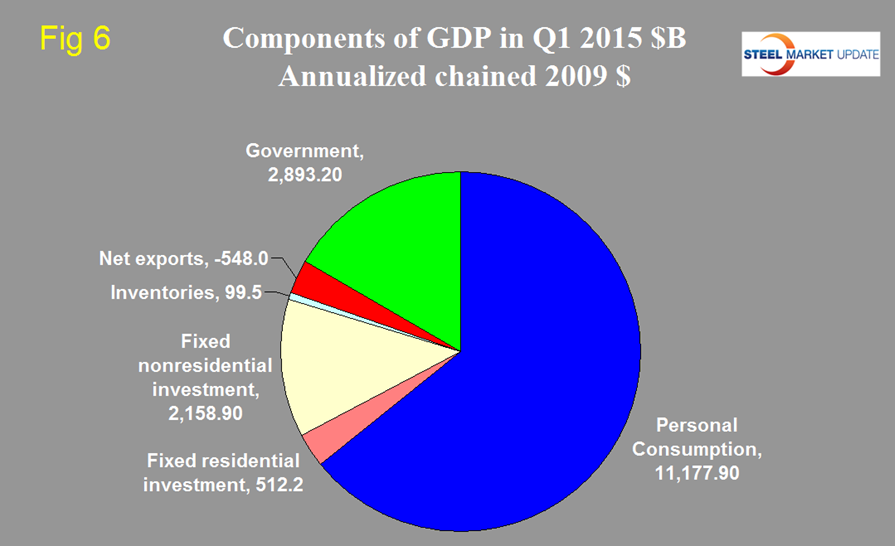
There are six major sub-components of the GDP calculation and the magnitude of these is shown in Figure 3.
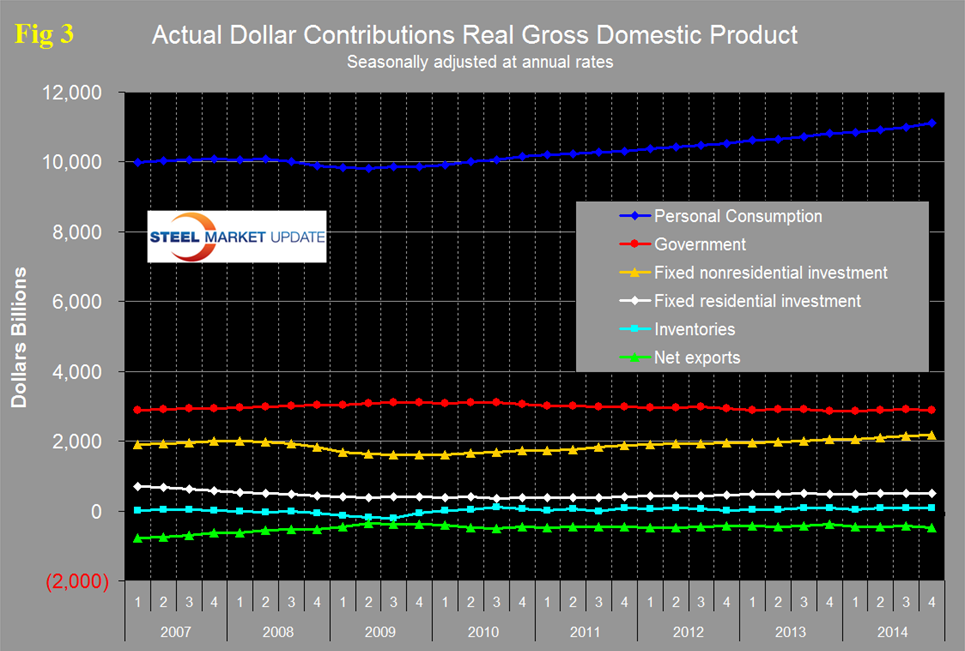
Personal consumption is dominant and in Q1 accounted for 68.63 percent of the total. Figure 4 shows the change in the major sub-components of GDP in Q1 2015.
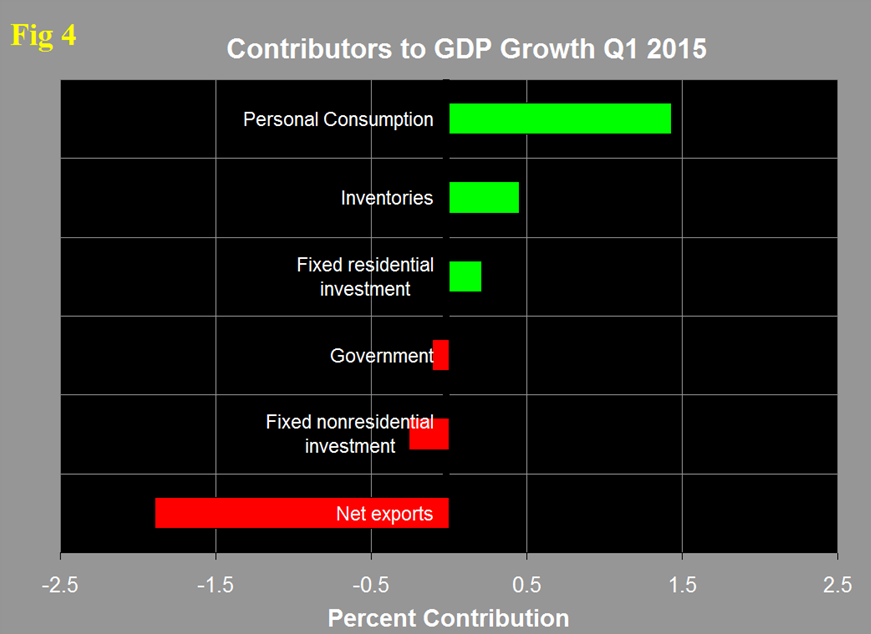
As can be seen net exports more than wiped out the contribution of personal consumption with respective values of negative 1.89 percent and positive 1.43 percent. The contribution of fixed non-residential investment has fallen steadily from positive 1.23 percent in Q4 2013 to negative 0.26 percent in the latest data. Figure 5 shows the same data as Figure 4 since Q1 2007 and describes the quarterly change in the six major sub-components of GDP.
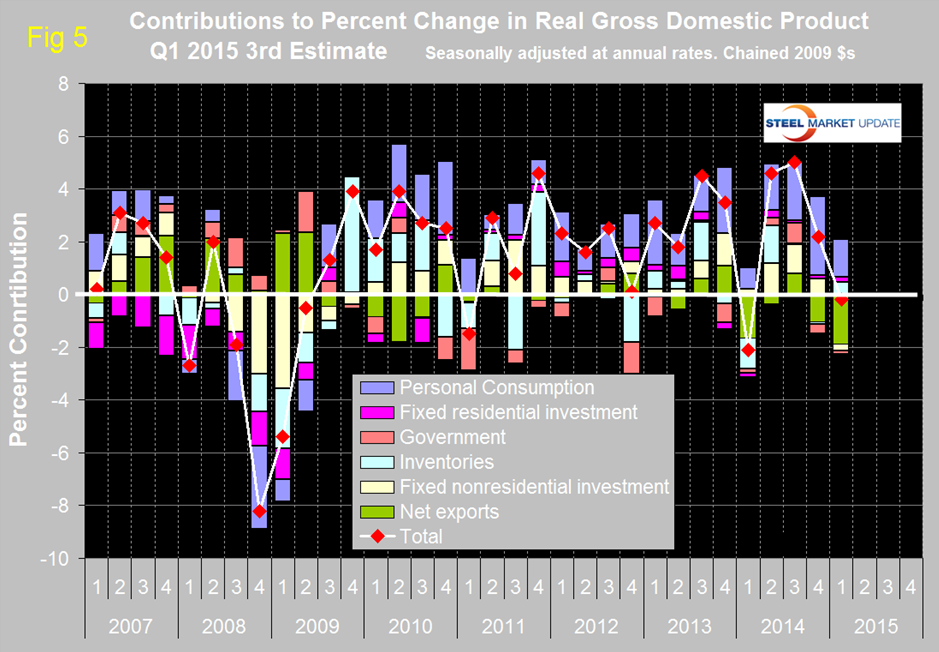
The effect of the change in net exports, driven by the appreciating US dollar is clear. Comparing Q1 with Q4 2014 there were major changes in the sub-components. Personal consumption that had contributed 2.98 percent in Q4 2014 fell to 1.43 in the latest data. Personal consumption includes goods and services, the goods portion of which includes both durable and non-durables. Net exports declined from negative 1.03 percent in Q4 2014 to negative 1.89 percent. Government expenditures improved from negative 0.35 percent to negative 0.11 percent. The contribution of fixed residential investment improved from 0.12 percent to 0.21 percent but the contribution of nonresidential construction declined from 0.6 percent in Q4 to negative 0.26 in Q1. Inventories which had contributed negative 0.1 percent in Q4 contributed positive 0.45 in Q1. Increasing inventories make a positive contribution to GDP and over the long run inventory changes are a wash and simply move growth from one period to another. Figure 6 shows the breakdown of the $16 trillion economy.
The official press release from the BEA reads as follows:
Real gross domestic product — the value of the production of goods and services in the United States, adjusted for price changes — decreased at an annual rate of 0.2 percent in the first quarter of 2015, according to the “third” estimate released by the Bureau of Economic Analysis. In the fourth quarter, real GDP increased 2.2 percent. The GDP estimate released today is based on more complete source data than were available for the “second” estimate issued last month. In the second estimate, the decrease in real GDP was 0.7 percent. With the third estimate for the first quarter, exports decreased less than previously estimated, and personal consumption expenditures (PCE) and imports increased more. The decrease in real GDP in the first quarter primarily reflected negative contributions from exports, nonresidential fixed investment, and state and local government spending that were partly offset by positive contributions from PCE, private inventory investment, and residential fixed investment. Imports, which are a subtraction in the calculation of GDP, increased.
NOTE: Quarterly estimates are expressed at seasonally adjusted annual rates, unless otherwise specified. Quarter-to-quarter dollar changes are differences between these published estimates. Percent changes are calculated from unrounded data and are annualized. “Real” estimates are in chained (2009) dollars. Price indexes are chain-type measures.
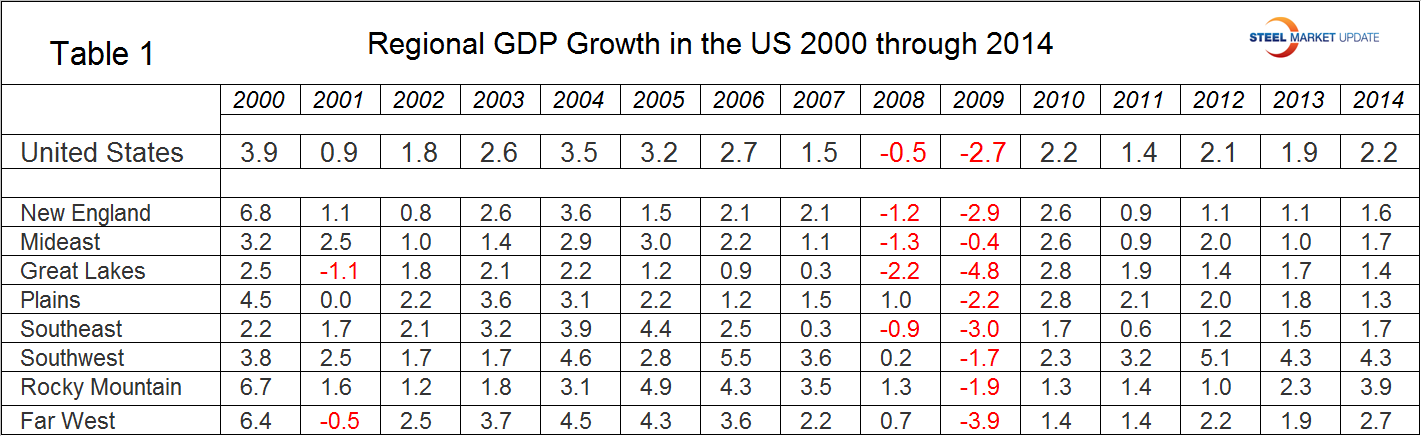
Regional GDP growth in the US. The Bureau of Economic Analysis is developing GDP data by region and state. On June 10th they published annual data through 2014. We don’t know at this point if they are going to break this data down into quarterly results but we will investigate this further. In the meantime, here is a first look at GDP by region (Table 1).
SMU Comment: We have reported frequently in the past on the relationship between GDP and steel consumption. Steel growth follows economic growth but is very much more volatile. In addition over the long run about a 2.5 percent growth of GDP is necessary to get any growth in steel consumption. Based on the trailing 12 month growth of GDP which in Q1 was 2.88 percent we can expect steel consumption to be fairly stable in H1 2015. The IMF forecast for 2015 at 3.09 percent growth, if accurate, suggests a moderate increase in steel demand.


