

Market Data

July 9, 2015
SMU Steel Buyers Sentiment Index: New Optimism Building?
Written by John Packard
Steel Market Update (SMU) has been measuring “Sentiment” or, how buyers and sellers feel about their company’s ability to be successful both in the current market environment as well as three to six months into the future. We concluded our analysis earlier today and have determined that those involved in the flat rolled steel industry continue to be moderately optimistic about both existing and future business expectations.
Our “Future” SMU Steel Buyers Sentiment Index was measured at +64 which is down 1 point from what we reported during the middle of June but within reach of the high for this calendar year which the +70 reported at the beginning of January.
Sentiment is measured on a plus/minus scale with positive reading (+) being optimistic for the industry and negative (-) readings representing pessimism. The most optimistic reading possible is +100 with the most pessimistic being -100.
At Steel Market Update we believe the best way to look at data is to use a rolling three month moving average. The 3MMA smooths out any bumps that we could collect during any one survey and provides a better view of the trend.
Our Future 3MMA is now +61.50 which is higher than one month ago and the most optimistic reading we have seen going back to the middle of March 2015. From mid-March until early June was saw slippage in the degree of optimism that existed within the flat rolled steel community. Since early June we have seen optimism on a bit of a rebound which to us means, barring any major economic calamity, that the industry expects business conditions to improve as we move through the summer and into Fall 2015.
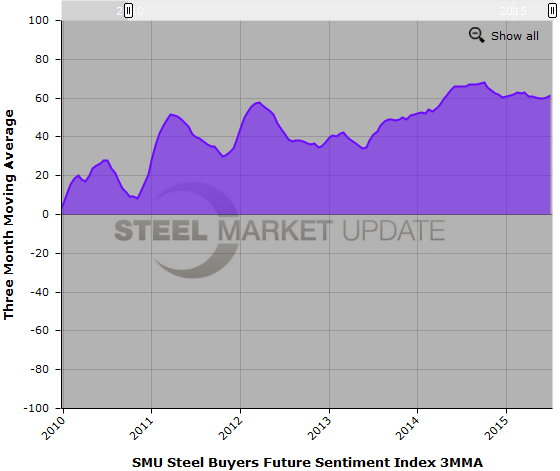
We saw similar movement in the Future 3MMA last year as the average improved each month, peaking at the beginning of October at +67.83. During the middle of October Future Sentiment 3MMA dropped off rather dramatically to the low point which was +60.5 during our mid-December report.
What Our Respondents Had To Say
The number of comments made during the survey process this week were modest in number and most referenced the “cloudy” picture due to the 4th of July Holiday in the United States.
A service center told us they had “cloudy tea leaves” and went on to say, “lag in the market this week because of the 4th of July holiday so not sure about the overall picture.”
A manufacturing company associated with the construction industry (especially residential) told us their business is, “Unstable with market uncertainty.”
We had a couple of companies report that demand for their products was slow but, we also had the following comment from a manufacturing company associated with farm equipment, “Farm and Ranch equipment sales continue to be strong. Up 20% YTD.”
Looking back at history the highest reading we have reported was +74 for our Future Buyers Sentiment Index back in mid-July 2014. The lowest reading we ever reported for Future Sentiment was -40 back in January 2009.
Current Sentiment was measured at +58, down 3 points from mid-June which was the highest reading of this calendar year. The highest reading ever recorded was the +68 reported in early August 2014. The lowest reading ever recorded was -85 in early March 2009.
About the SMU Steel Buyers Sentiment Index
SMU Steel Buyers Sentiment Index is a measurement of the current attitude of buyers and sellers of flat rolled steel products in North America regarding how they feel about their company’s opportunity for success in today’s market. It is a proprietary product developed by Steel Market Update for the North American steel industry.
Positive readings will run from +10 to +100 and the arrow will point to the right hand side of the meter located on the Home Page of our website indicating a positive or optimistic sentiment.
Negative readings will run from -10 to -100 and the arrow will point to the left hand side of the meter on our website indicating negative or pessimistic sentiment.
A reading of “0” (+/- 10) indicates a neutral sentiment (or slightly optimistic or pessimistic) which is most likely an indicator of a shift occurring in the marketplace.
Readings are developed through Steel Market Update market surveys which are conducted twice per month. We display the index reading on a meter on the Home Page of our website for all to enjoy.
Currently, we send invitations to participate in our survey to almost 600 North American companies. Our normal response rate is approximately 110-170 companies. Of those responding to this week’s survey, 43 percent were manufacturing and 44 percent were service centers/distributors. The balance of the respondents are made up of steel mills, trading companies and toll processors involved in the steel business.
Click here to view an interactive graphic of the SMU Steel Buyers Sentiment Index or the SMU Future Steel Buyers Sentiment Index.


