

Market Data

July 20, 2015
China’s Economic Statistics Q2 2015
Written by Peter Wright
Figure 1 shows published data for the growth of GDP, industrial production and consumer prices through Q2 2015.
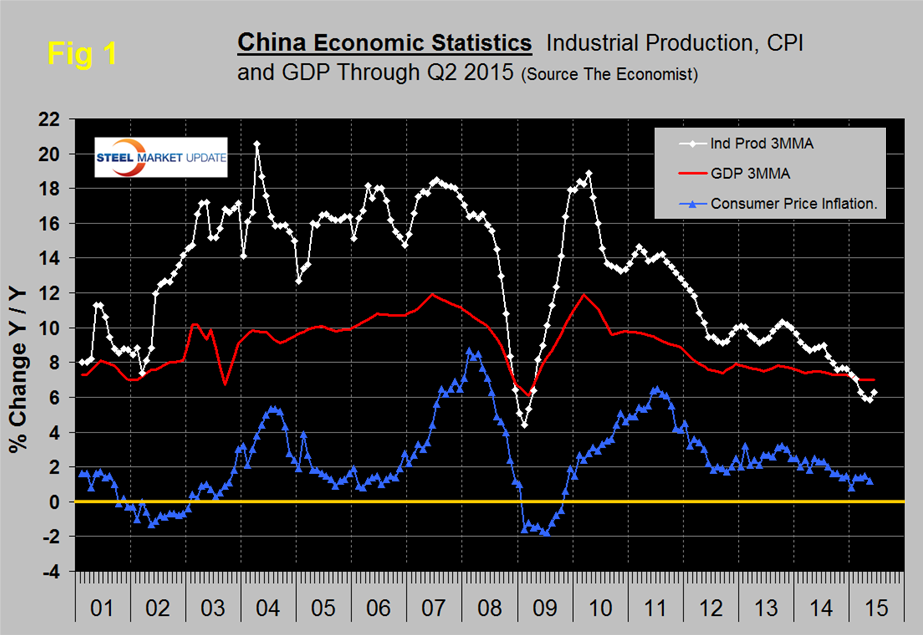
The GDP and industrial production portions of this graph are three month moving averages. The growth of GDP was unchanged in the Q2 at 7.0 percent which was faster than the 6.8 percent median forecast of 39 economists in a Bloomberg survey. Capital Economics Ltd. said it’s probably overestimated by as many as two percentage points due to an inaccurate GDP deflator. China’s statistics office defended its gross domestic product data. The National Bureau of Statistics uses “high quality” raw data and methods “in line with international standards and norms” for results that “objectively reflected” economic reality, Xu Xianchun, a deputy head in charge of compiling the number, said in a statement on Friday. More than 900,000 companies across the country can now directly report their data to the bureau without the need to go through local governments, he said.
The three month moving average (3MMA) of the growth of industrial production increased in June to 6.3 percent from 5.9 percent in May, this followed six straight months of decline. However secondary industries slowed as the housing slump continued to weigh on construction. Over-investment in various industries such as steel and housing is still a drag and commodity prices continue to decline. The government’s ongoing program to re-balance the economy in favor of domestic consumption is continuing and this will slow the absorption of the excess steel capacity that has arisen during the last decade.
Consumer price inflation has been falling for over 18 months and in May reached 1.2 percent. June CPI data is not yet available.
Figure 2 shows the growth of fixed asset investment y/y.
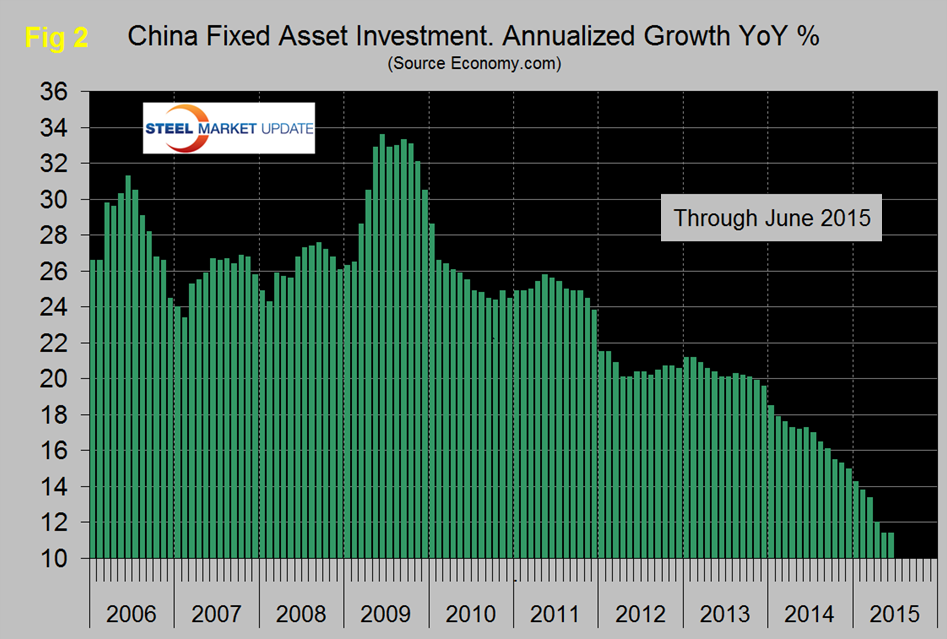
The decline experienced in 2013 accelerated through all of 2014 and through May of 2015. At 11.4 percent June was unchanged from May. We understand that this data includes real-estate purchases so is not a direct reflection of constructional steel demand. We are assuming that the steel on the ground portion of this data follows the overall trend and that the contraction in FAI is in accordance with the stated objective to rebalance the economy in favor of consumer consumption. Weaker investment in fixed assets is contributing to slower demand across a number of industries including steel and is pressuring corporate profits.
SMU Comment: The fears of the global steel industry that Chinese overcapacity would eventually become critical are coming to pass. China steel production through May 2015 totaled 340 million tonnes, down 1.6 percent y/y, as reported by China Metals Weekly. Imports of iron ore have been trending down for over a year. Chinese global exports totaled 43.6 Mt, YTD through May, a y/y increase of 37.8 percent, representing 9.4 percent of production. Chinese steel shipments to the US, as reported by SIMA, totaled almost 3 million tonnes in 12 months through June.


