Prices

July 20, 2015
SMU Analysis: Iron Ore, Metallurgical Coal & Zinc
Written by Peter Wright
This piece, written by Peter Wright, combines our own data analysis with recently published opinions about the iron ore, metallurgical coal and zinc markets that we find credible.
Iron Ore: The Platts IODEX of 62% Fe delivered North China recovered to $61.25 per dry metric ton (dmt) on May 22nd but by July 10th had fallen back to $48.75 (Figure 1).
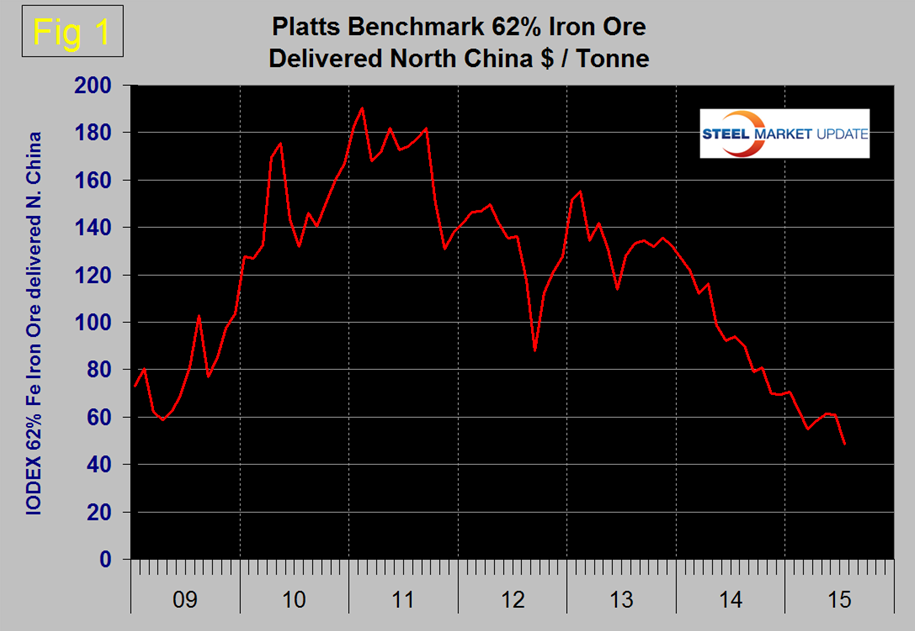
In these reports we will try to describe where we think the price of ore seems to be headed. From Valuentum Securities, July 13th. “In relation to the slowing Chinese economy, global oversupply of many metals markets is not going away. Recent expansions by BHP Billiton and Vale are expected to swell the global surplus of iron ore to ~215 million metric tons by 2018, compared to the expected ~45 million metric ton surplus in 2015. The price movement of iron ore is a prime example of the delicacy of supply and demand within a cyclical, commoditized industry. The normalization of growth of the Chinese economy will help to eventually balance the market, but before then, prices may drop near record lows once again until high-cost suppliers are forced out of the market, normalizing supply and representing a truer tightening of the market.
“Though the second half of 2015 looks more promising than the environment of the past few years, an expected iron ore global surplus beginning in 2016 cannot be ruled out. BHP’s CEO explained that his firm does not believe Australian iron producers should slow production during periods of economic weakness or downward pricing pressure, an indication that the global surplus may be more difficult to overcome than some initially expected. In this light, it’s difficult to be very positive on the long-term outlook for the iron ore markets, regardless what happens through the remainder of 2015. Prices may be under pressure for some time.”
From Alpha World July 20th. “BHP Billiton and Vale are committed to their strategy of increasing production to capture market share. In September, the Roy Hill project in Australia will also go online. The first shipment from the project is expected in September and is expected to reach full capacity ahead of schedule. While demand for iron ore has been slowing due to China, supply of seaborne iron ore is expected to rise to record levels. It is estimated that the seaborne iron ore market will hit 1.4 billion tons this year. Bloomberg, citing data from Morgan Stanley, recently noted that the glut in the seaborne market is expected to reach 58.1 million tons this year itself and then rise to 83.2 million tons by 2020. And then there is weakness on the demand side, primarily in China. Low prices will eventually drive out high cost miners in China and elsewhere. This is essentially the big three mining companies’ strategy.”
Scrap: There is a long term relationship between the prices of scrap and iron ore. Figure 2 shows the IODEX, and the price of Chicago shredded through July 10th.
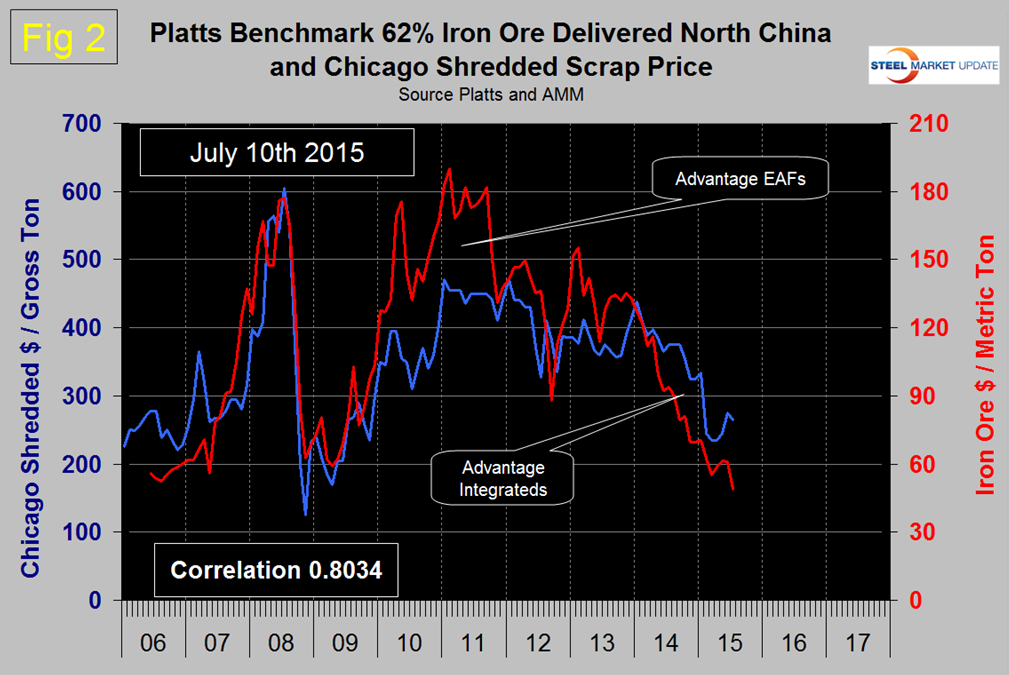
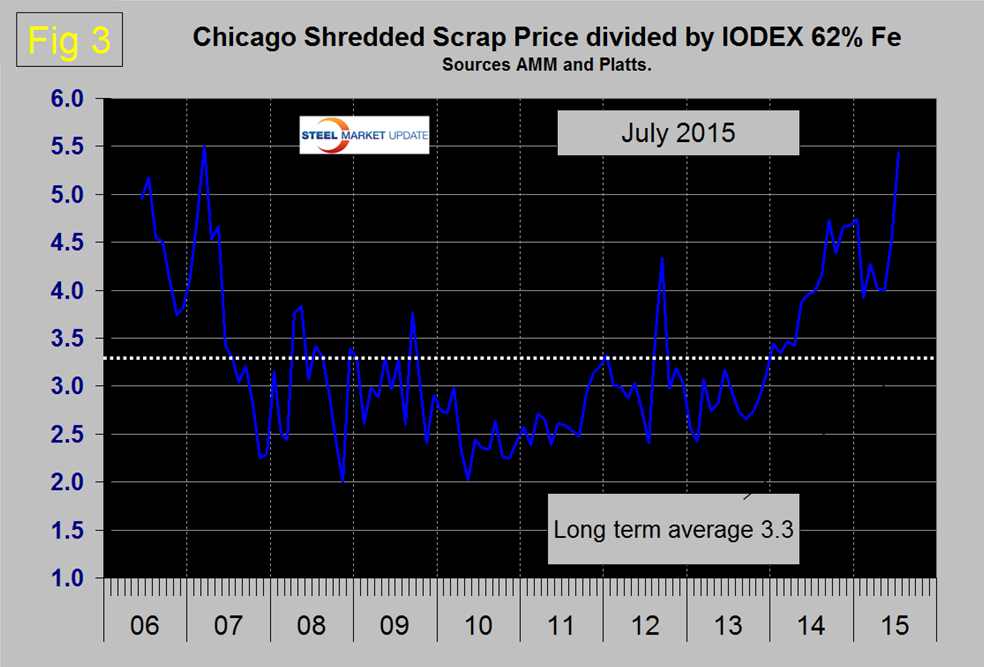
The price of Chicago shredded advanced by $30 in June and gave back $10 in July. The correlation between scrap and ore since January 2006 has been 0.8054. In the period 2007 through 2009 the correlation was 91.82 but the relationship became decoupled in 2010 and 2011 when the big 3 ore cartel began to eliminate long term contracts. We see a similar decoupling in the other direction today caused by the oversupply of ore. In the long term, Chicago shredded has been 3.3 times as expensive as the IODEX with quite a wide spread in each direction. For four years through December 2013 scrap was advantageously priced on a historical basis compared to ore. Throughout 2014 scrap became increasingly uncompetitive and today the ratio is 5.4 (Figure 3).
There is a close non causal relationship between the price of scrap and the price of oil. Figure 4 shows the scrap/oil relationship through July 13th with a correlation of 0.9264 since January 2000 and 0.9346 in the 25 years since January 1990.
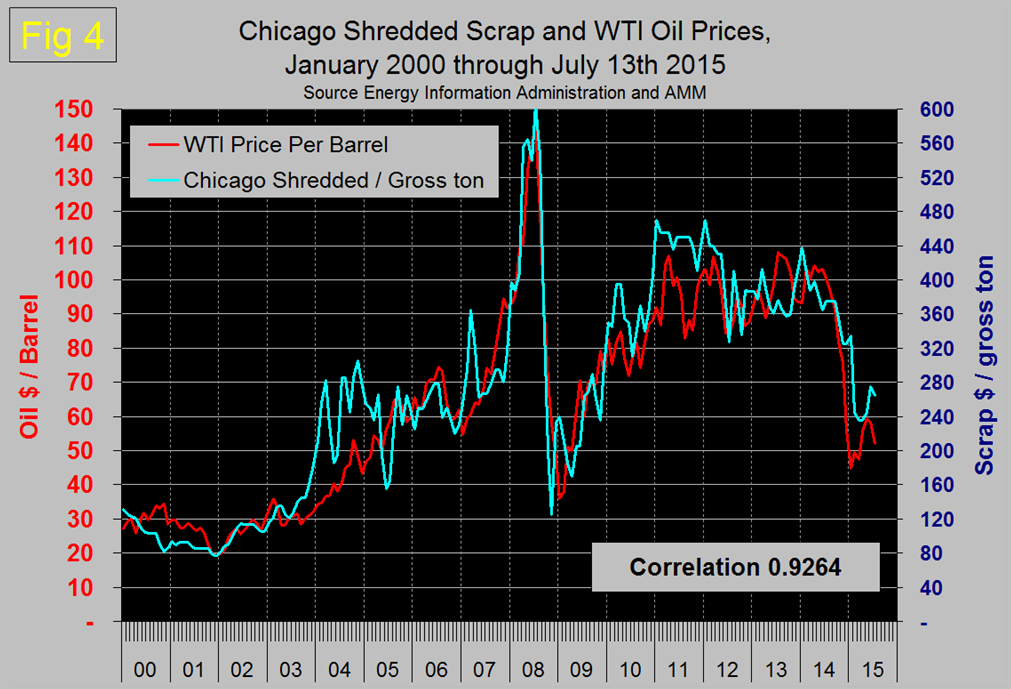
It was clear in December last year that if history was a guide, scrap was headed for a fall and this occurred in February. The relationship came back in line in April but since then the price of scrap has been out of line on the high side suggesting that a scrap price correction is imminent. Figure 5 shows the relationship between shredded and #1 busheling both priced in Chicago.
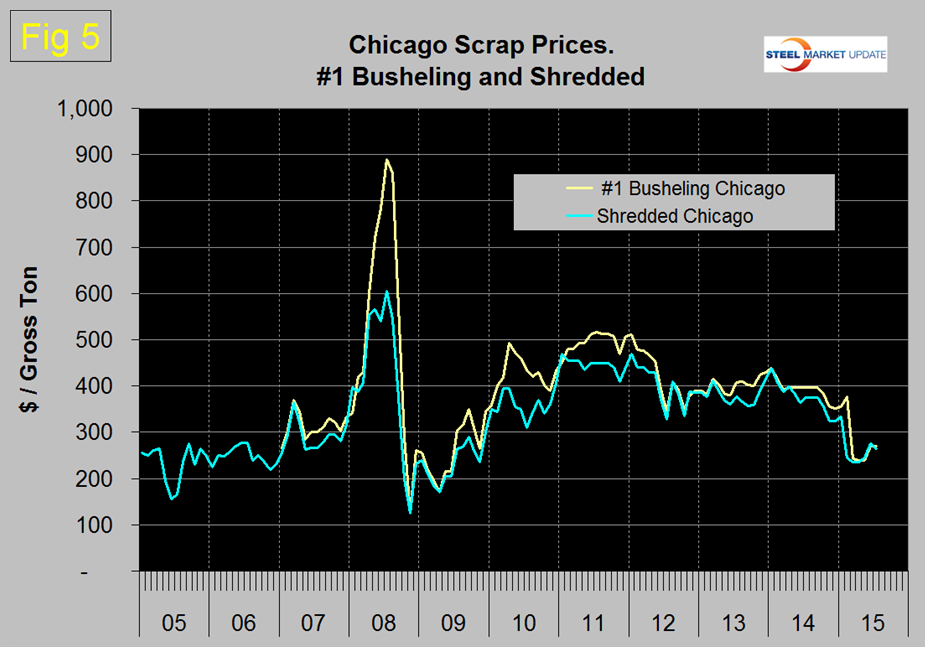
In May and June busheling was $5.00/gross ton cheaper than shredded but in July that has reversed.
Coking Coal: The price of coking coal FOB East Australian ports declined steadily from $110.00/metric ton on January 2nd and bottomed out on May 15th at $81.65. Then the price rose every week to reach $88.70 on June 19th. Since then the price has steadily declined to $81.30 on July 13th (Figure 6).
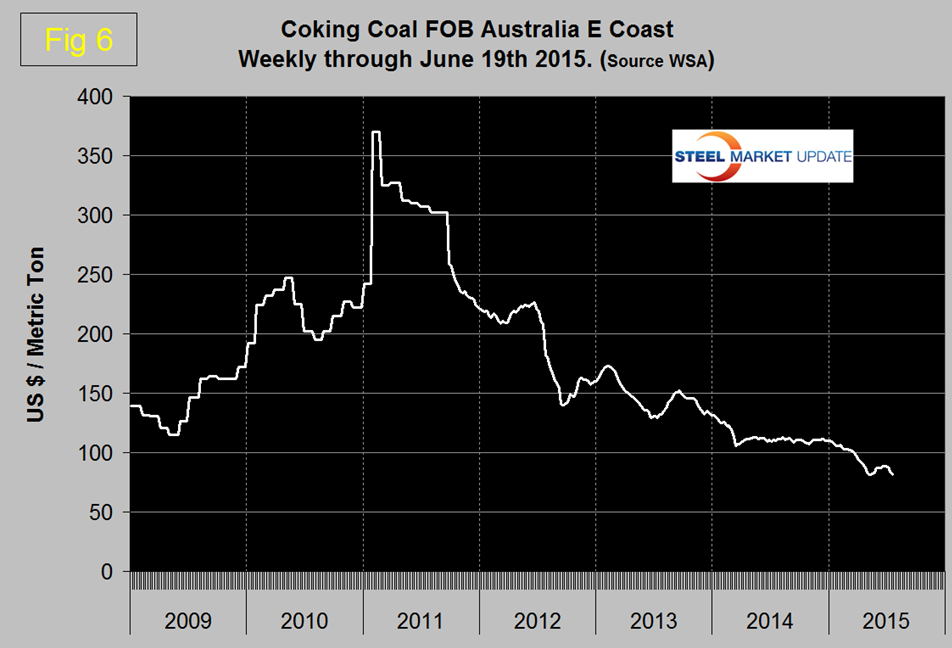
In the second half of July, the coal market continued to deteriorate based on the pessimistic outlook in the Chinese steel market. Requiring no additional volumes, consumers insist on discounts. Oversupply has left no other choice for exporters but to back down.
From Colorado Wealth Management Fund, July 2015. “Coal has been a fairly ugly asset recently. The industry is seeing far too much competition created by excess supply and China is responding precisely how you might imagine. The Chinese government is creating barriers to selling coal within their borders. In one scenario those barriers may be simple tariffs, in the other scenario they are regulatory standards that may be imposed more harshly on imported coal than on domestic coal. There could also be intentional delays in the inspection of coal to create operational challenges for the importers of coal. Remember that China doesn’t just consume coal, it also has several companies that produce coal domestically. In a reasonable level of self-interest, China would prefer to see their companies succeed since it means employment and tax revenue. On the other hand, protecting inefficient production drives up the cost for acquisitions of coal and makes their production of electricity less efficient. Coal imports by China were down by 38 percent year over year through the first five months of 2015, which may fuel speculation that the environmental standards are being used to reduce imports rather than to reduce pollution.”
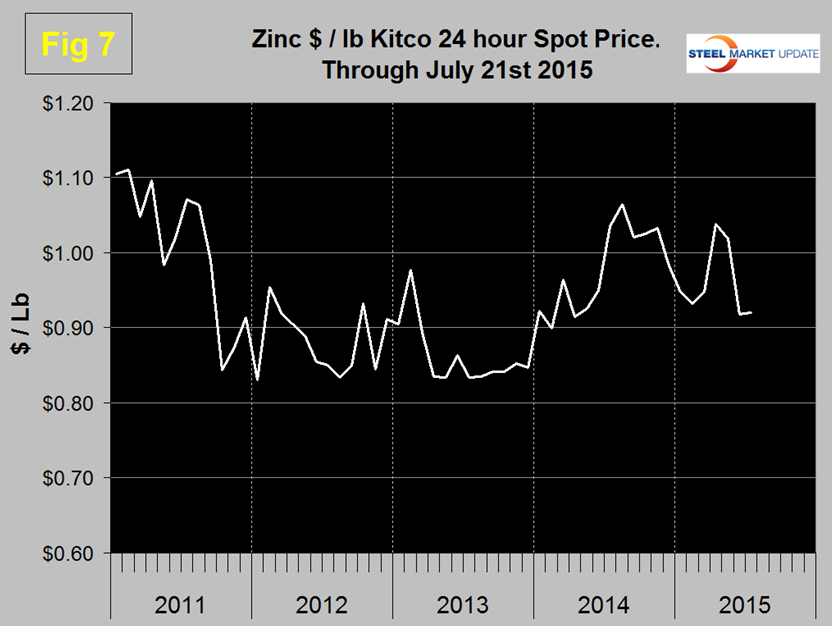
Zinc: According to the International Zinc Association, the major use of zinc is for galvanizing, other significant uses include the alloying of brass and bronze and in zinc-based alloys used in the die-casting industry. Kitco publish a daily spot price of zinc which we have transcribed to Figure 7. At the end of April the 30 day spot peaked at 1.0381 but since then the price has slid to $0.9205 on July 21st.