

Market Data

August 12, 2015
Currency Update for Steel Trading Nations
Written by Peter Wright
We have two data sources for this report. These are the Federal Reserve and the Oanda forex trading platform. An explanation of these sources is given at the end of this report. Oanda is current every day but the Federal Reserve daily broad index (BI) is normally about eight days in arrears. As of August 11th the Fed’s latest daily update was August 7th, therefore four days behind the individual steel trading currency data that we are presenting here.
Figure 1 shows that the value of the US dollar as recorded by the daily BI had a recent low point of 114.1 on June 18th and has since had an uninterrupted surge to 118.7 on August 7th.
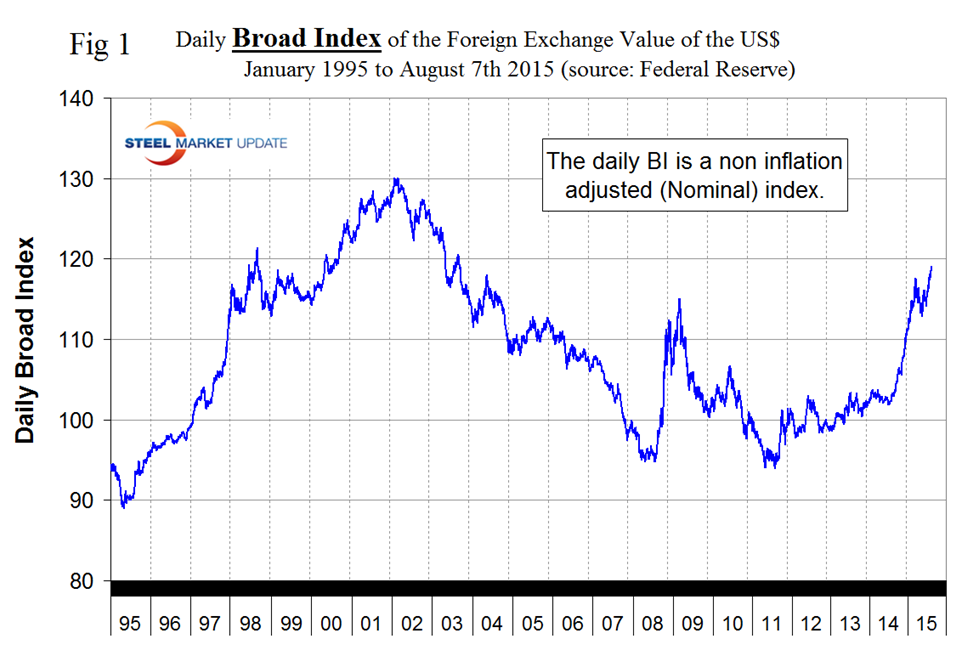
This is the dollars strongest value in over 11 years. It does not necessarily follow that the steel trading currencies follow the BI. In the last three months the dollar has strengthened against 15 of the 16 steel trading nations that we examine in this report, in the last month it has strengthened against 14 and in the last 7 days has strengthened against only eight.
Table 1 shows the number of currency units of steel trading nations that it takes to buy one US dollar and the change in one year, three months, one month and seven days.
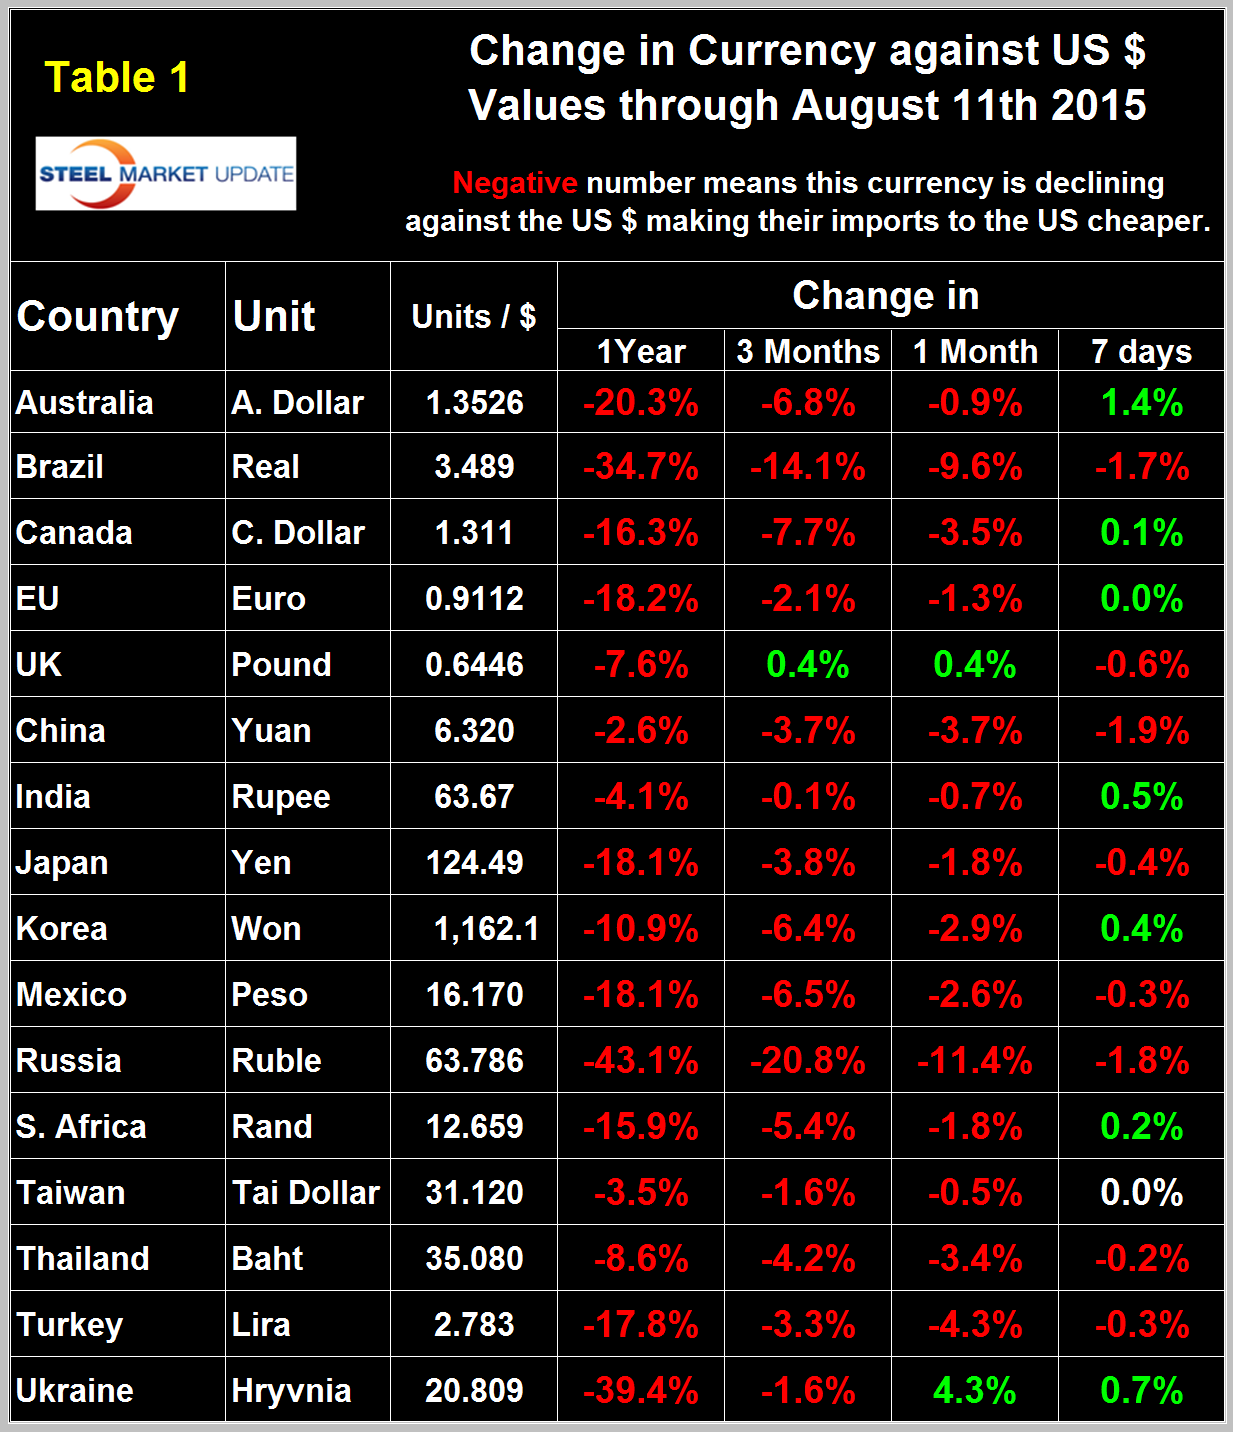
The table is color coded to indicate strengthening of the dollar in red and weakening in green. We regard strengthening of the US Dollar as negative and weakening as positive because the effect on net imports. In 2014, 25 percent of the U.S. economy was related to international trade therefore currency swings can have a huge effects on the economy in general and of the steel industry in particular. At the 12 month level the dollar has strengthened against every one of the steel trading currencies.
In each of these reports we comment in some detail on a few of the 16 steel trading currencies but charts for each are available through August 11th for any reader who requests them.
The Chinese Yuan. China devalued its currency on Tuesday after a run of poor economic data, a move it billed as a free-market reform but which some suspect could be the beginning of a longer-term slide in the exchange rate. The central bank set its official guidance rate down nearly 2 percent to 6.2298 yuan per dollar – its lowest point in almost three years (Figure 2).
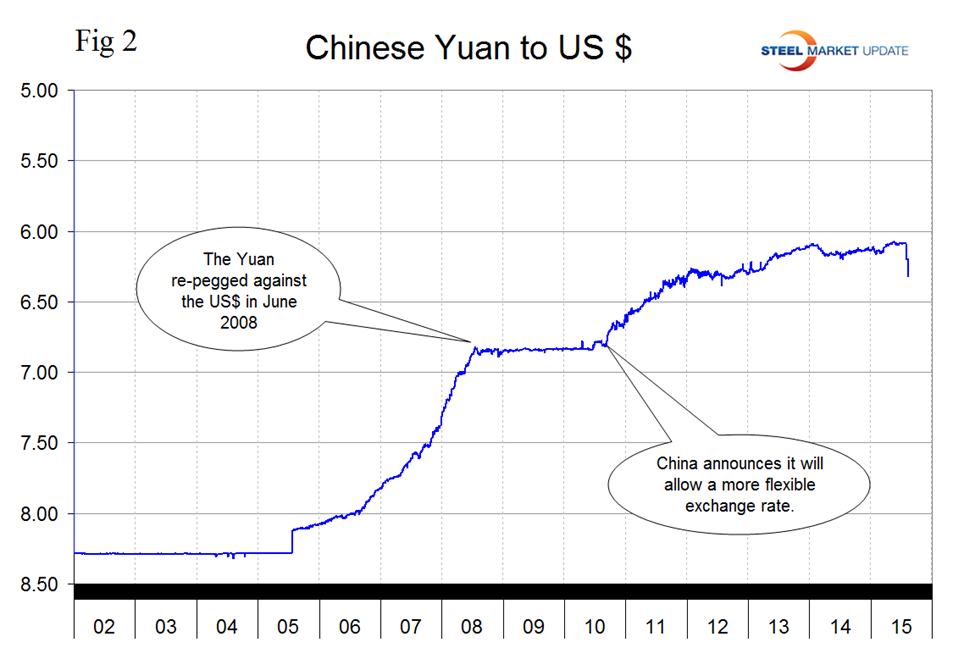
The devaluation was said to be based on a change in methodology to make the Yuan more responsive to market forces. It was the biggest one-day fall since a massive devaluation in 1994 when China aligned its official and market rates. The Yuan had been locked in an extremely narrow intraday range since March, varying only 0.3 percent. Some economists said the devaluation was also designed to support Beijing’s push for the Yuan to be included in a basket of reserve currencies known as Special Drawing Rights (SDR), which are used by the International Monetary Fund to lend money to sovereign borrowers. “The PBOC aims to move the Yuan to a freer floating and accessible currency, prerequisites for it to be given the IMF’s reserve stamp of approval, and will see it move in a wider band,” said Angus Campbell, analyst at FXpro. The IMF proposed in a report this month to put off any move to add the Yuan to its benchmark currency basket until after September 2016, and it gave mixed reviews of Beijing’s progress in making key financial reforms to its currency market. The surprise devaluation of the yuan is roiling markets across the globe as investors weigh the implications of the unforeseen move. Exporters are dragging stocks lower, while commodities are down amid speculation the weaker currency will make imports more expensive and slow demand. Although the move shook forex markets in Asia earlier, the decision is expected to add further momentum to the strong dollar, which has already been boosted this year on prospects for higher U.S. interest rates.
At SMU we continue to regard the saga of the Euro as having the most significant future impact on the US steel industry. The Euro had a recent low of 1.050 on March 16th, then recovered to 1.1452 on May 18th and has since declined to 1.0975 on August 11th (Figure 3).
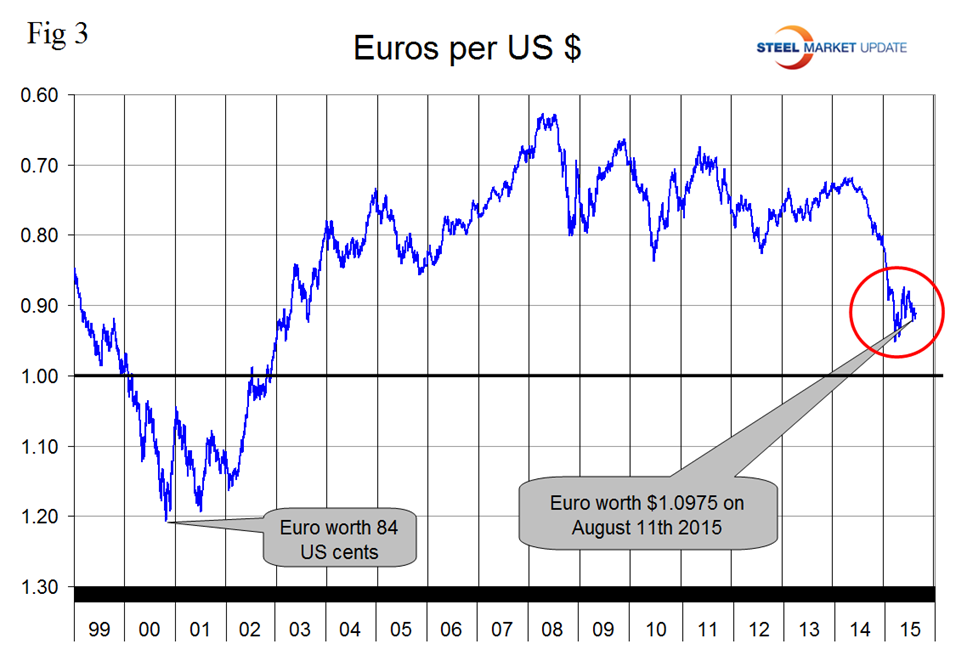
At SMU we continue to support the view that the Euro zone as it currently exists is unsustainable unless an integrated monetary and fiscal union is created which is what we have between these United States of America. We also believe that the likelihood of this happening is close to zero and that the downside for the US steel industry is huge. On July 16th Charles Hugh Smith wrote; “The problem with not having a national currency is that there is no mechanism to rebalance trade imbalances. In the real world, nations generally run trade surpluses or deficits. A trade deficit is a negative balance of trade incurred when a country’s imports exceed its exports. A trade deficit is settled by an outflow of domestic currency to foreign markets. Countries with trade surpluses end up with cash from their trading partners, while countries with trade deficits must pay the difference between their exports and imports. Trade must balance: every nation cannot run a trade surplus. The problem for nations with current account deficits is: where do they get the money to settle their negative balance of trade? Nations with their own currencies can simply create the money out of thin air. National currencies provide a mechanism for rebalancing trade deficits. By eliminating national currencies, the Eurozone also eliminated the only market mechanism for rebalancing trade imbalances. With no currency mechanism left, nations borrow money to fund their trade deficit. This is the engine of Greek debt since that nation adopted the euro in 2001. If Greece had kept its national currency, trade deficits would have declined as the Greek currency depreciated and the cost of imports soared. Lenders would not have based their loans on the illusory guarantee of Eurozone membership. For nations running large structural trade deficits, membership in the Eurozone was a guarantee of financial disaster, as the way to fund the deficit within the Eurozone was to borrow more money.” As steel people we have little direct interest in Greece except that it is the canary in the coal mine. Germany in particular has such a dominant trade position in the EU that it is creating imbalances with countries with higher unit labor costs. The question is whether Germany will ever accept a continuous wealth transfer to less efficient countries with the upside of maintaining their manufacturing base which is enormously export driven.
The Russian Ruble had an all-time low of 70.035/US $ on February 2nd, recovered to 49.17 on May 18th and has since declined steadily to 63.79 on August 11th (Figure 4).
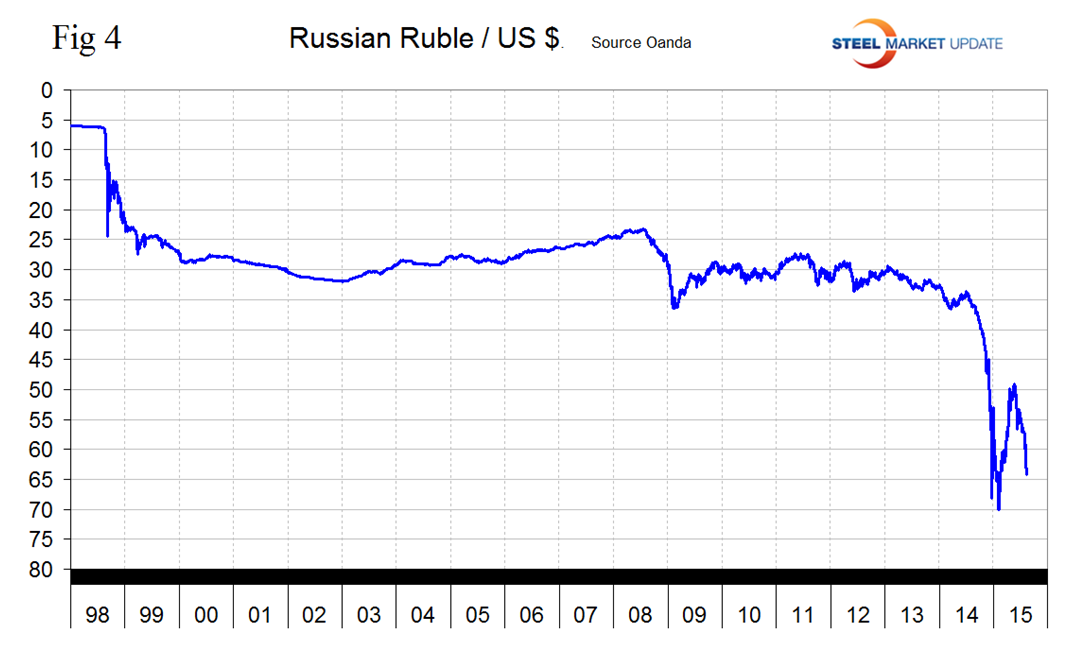
The rout on commodities markets has overshadowed the first signs of stabilization in Russia by hammering the ruble and shaking a country that relies on oil and gas for about half of its budget revenue. The nation is enduring its first recession in six years as sanctions over Ukraine choked access to capital markets. Last month Russia’s central bank reduced interest rates for the fifth time this year as the nation’s economic slump worsened. Governor Elvira Nabiullina is keeping the focus on Russia’s recession as inflation slows and a potential U.S. rate increase risks sapping cash from developing nations. Gross domestic product contracted 4.6 percent in the second quarter from a year earlier after a 2.2 percent decline in the previous three months. That was worse than the median forecast for a 4.5 percent slump in a Bloomberg survey of 18 analysts. The Economy Ministry had projected that output shrank 4.4 percent in the period, calling it “the lowest point” for Russia.
The Canadian $ has declined by 16.3 percent in the last twelve months. In the last month it declined by 3.5 percent and stood at 76.26 US cents on August 11th (Figure 5).
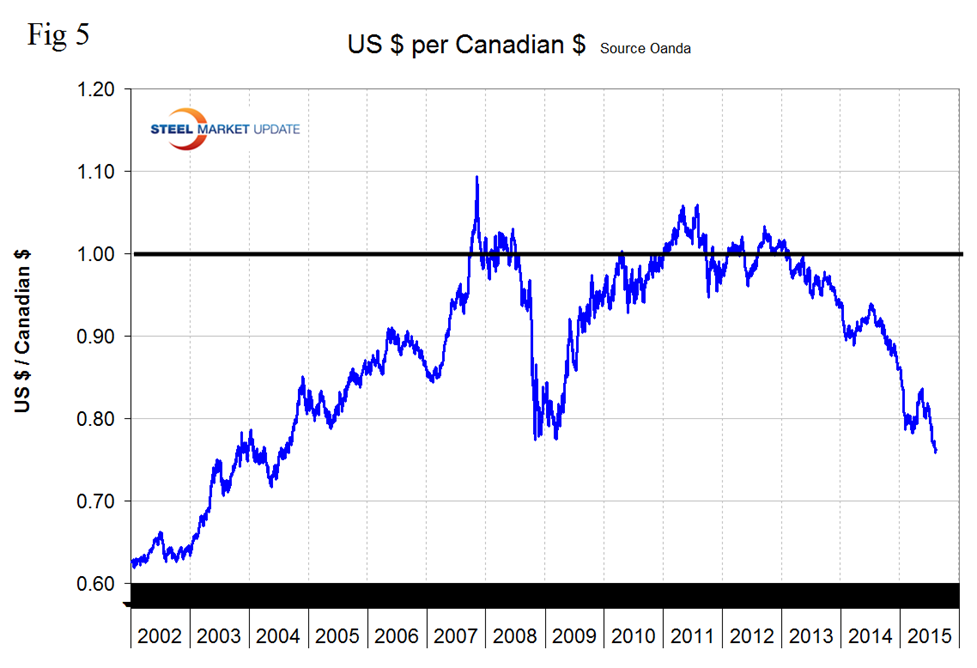
The Canadian dollar, like other commodity and interest rate sensitive currencies, has been under immense pressure from the flight to quality trading strategies. The loonie has also been dragged lower by softer crude and gold prices. Being so heavily tied to the resource sector has really taken a toll on the Canadian economy. GDP shrank 0.6 percent in the first quarter, much worse than economists had expected. To help prop up the Canadian economy, the Bank of Canada has cut interest rates twice this year. The bank just recently cut the overnight rate 25 basis points to 0.5 percent. All of these factors have led the Canadian dollar steadily lower. While the Bank of Canada is cutting rates, the Fed is debating not if, but when to raise interest rates. With oil just above $50 and gold $1100, that’s not going to help the Canadian economy. Canada may have to keep rates lower for longer in order to boost economic growth. For instance, Euro area GDP growth in the 2nd quarter was 0.4 percent, while that of Canada was -0.1 percent. Given that the ECB is open to raising interest rates after September 2016, it is possible that Canadian rates may stay lower for longer if growth does not catch up with Europe during this time. Should the Bank of Canada be forced to keep interest rates low for a long period then rising rates in other countries will lead to less demand for the loonie as investors seek a higher returns elsewhere.
The Brazilian Real has declined by 34.7 percent in the last 12 months and by 9.6 percent in the last month closing at 3.4894 on August 11th (Figure 6).
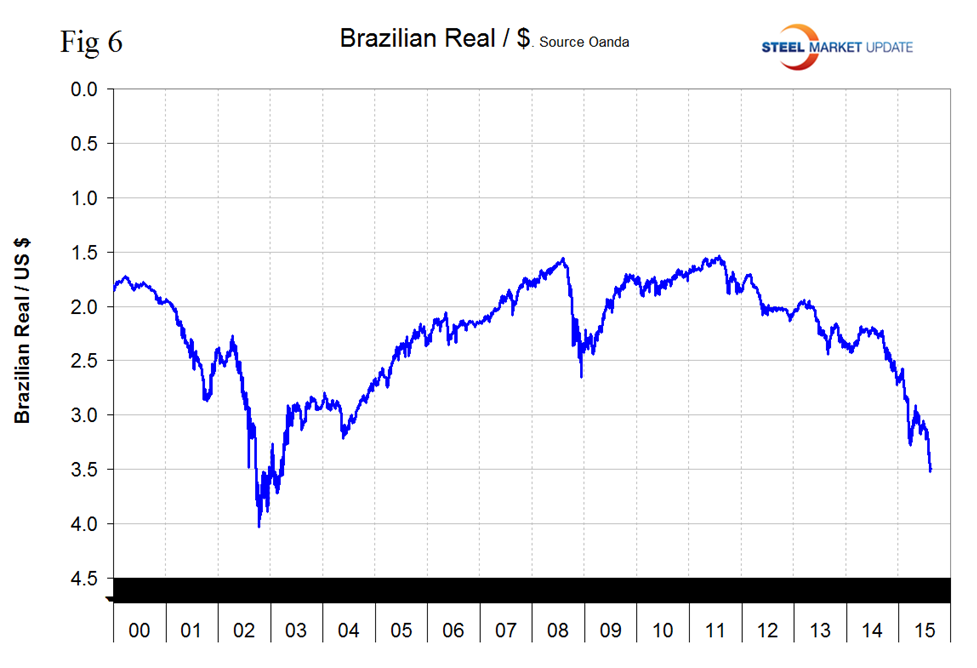
The IMF released a report on the effect of a strong US $ on emerging markets on July 29th a summary of which is included here; “Historically, although stronger growth in the U.S. increases growth in emerging markets, U.S. dollar appreciation amplifies the impact on real GDP growth in emerging markets through an income effect: as the dollar appreciates, commodity prices fall; weaker commodity prices depress domestic demand via lower real income; real GDP in emerging markets decelerates; and vice versa. These effects hold despite any potential expenditure-switching effect resulting from the relative currency depreciation of emerging market economies. We also show the negative effect on emerging markets’ growth of U.S. interest rates beyond the effects of the U.S. real exchange rate and real GDP growth. Therefore, at the time of writing, emerging markets’ growth is expected to remain subdued reflecting the expected persistence of the strong dollar and the anticipated increased in the U.S. interest rates.” Standard & Poor’s has warned Brazil it could lose its coveted investment-grade rating in the coming year if fallout from a number of corruption investigations further stymies economic growth and implementation of austerity measures. The agency has now put the country’s foreign currency rating, which is rated one notch above junk, on negative outlook for possible downgrade.
The Mexican Peso declined abruptly at the end of last year and more steadily though erratically ever since to close at 16.17 on August 11th (Figure 7).
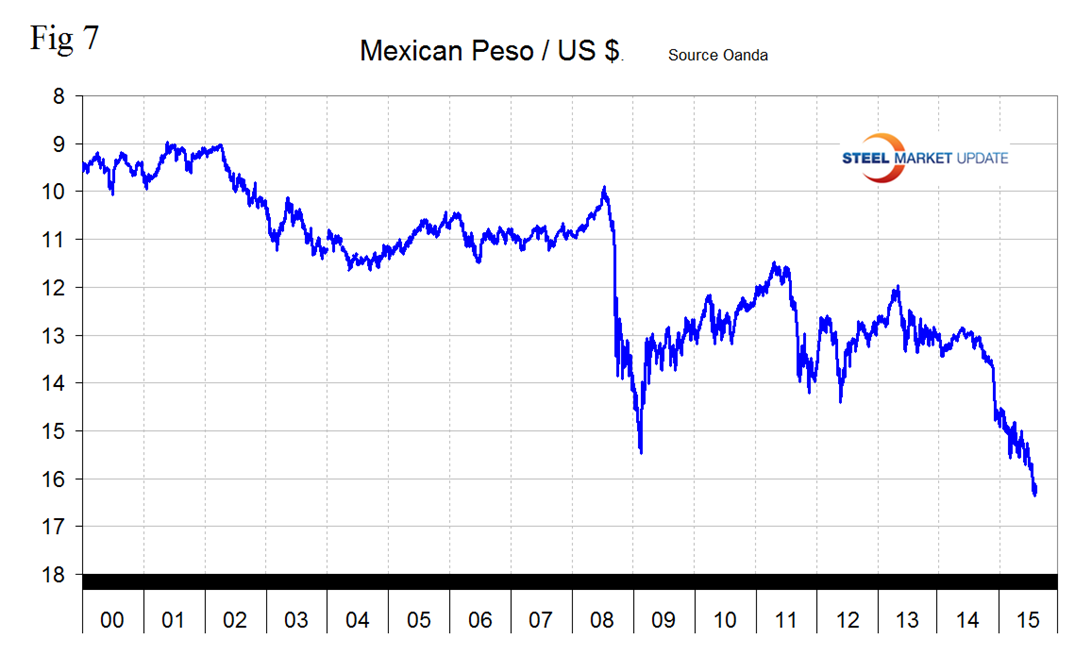
The peso is down by 18.1 percent in 12 months and by 2.6 percent in the last month. Economic activity has been adversely affected by lower factory output and weak consumer spending. This has weighed on investor sentiment, pushing the peso lower. With more U.S. dollar strength likely in coming months, the slowing Mexican economy should lead to further depreciation of the peso. From Bloomberg Business July 30th. Mexico’s central bank kept borrowing costs unchanged at a record low, saying the outlook for growth has worsened, while also expanding programs designed to prop up the peso. Banco de Mexico’s board, led by Governor Agustin Carstens has left the overnight rate at 3 percent. At the same time, the nation’s currency commission announced an expansion of daily dollar sales and a lower trigger for a separate extraordinary dollar sale. The central bank stated at the end of July that it will be necessary to adjust monetary policy in a timely way, implying that a rate hike is possible. Policy makers repeated their forecast for inflation to remain below 3 percent for the rest of this year.
SMU Comment: The dollar actually weakened against 7 of the 16 steel trading currencies in the last 7 days but based on the trajectory of the broad index and on recent press reports we don’t expect this to continue. The Japanese Yen at is at its lowest level since 2003 at 124.29/US $ and the Turkish Lira at 2.783/US $ is at an all-time low. The probability of a yield increase for US treasuries coupled with quantitative easing elsewhere will drive the dollar value higher. This is not good for US steel producer competitiveness. The currency trends will continue to attract imports and suppress both exports and raw materials prices.
Explanation of Data Sources: The broad index is published by the Federal Reserve on both a daily and monthly basis. It is a weighted average of the foreign exchange values of the U.S. dollar against the currencies of a large group of major U.S. trading partners. The index weights, which change over time, are derived from U.S. export shares and from U.S. and foreign import shares. The data are noon buying rates in New York for cable transfers payable in the listed currencies. At SMU we use the historical exchange rates published in the Oanda Forex trading platform to track the currency value of the US $ against that of sixteen steel trading nations. Oanda operates within the guidelines of six major regulatory authorities around the world and provides access to over 70 currency pairs. Approximately $4 trillion US $ are traded every day on foreign exchange markets.


