

Market Data

August 14, 2015
Shipments and Supply of Sheet Products through June 2015
Written by Peter Wright
This report compares domestic mill shipments and total supply to the market. It quantifies market direction by product and enables a side by side comparison showing the degree to which imports have absorbed demand. Sources are the American Iron and Steel Institute and the Department of Commerce with analysis by SMU. Table 1 shows both supply and mill shipments of sheet products (shipments includes exports) side by side as a three month average for the periods April through June for both 2014 and 2015.
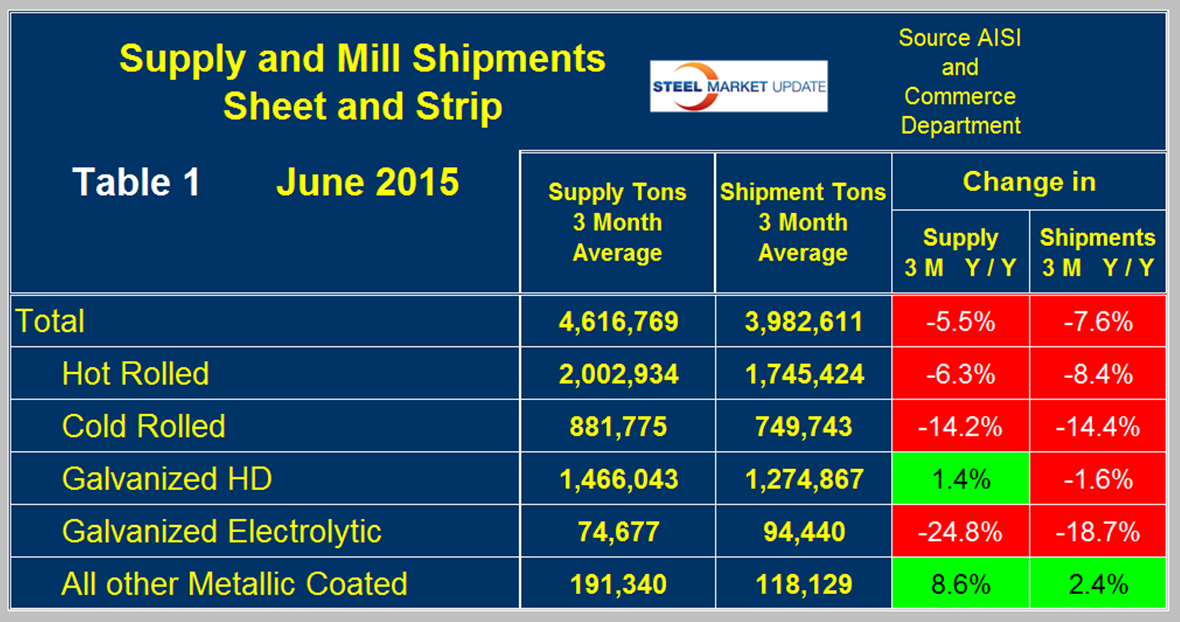
Comparing these two periods total supply to the market was down by 5.5 percent but shipments were down by 7.6 percent. In other words, imports took share from the domestic mills. Table 1 breaks down the total into the individual sheet products. Supply of hot and cold rolled was down by 6.3 percent and 14.2 percent respectively year over year and US mill shipments were down by 8.4 percent and 14.4 percent respectively. HDG had a 1.4 percent gain in supply but shipments were down by 1.6 percent. Electro-galvanized which enjoys a trade surplus had a greater decline in supply than it did in shipments. Other metallic coated products, (mainly Galvalume) continued to buck the trend and enjoyed an 8.6 percent increase in supply and a 2.4 percent increase in shipments. A review of supply and shipments separately for individual sheet products is given below.
Apparent Supply is a proxy for market demand and is defined as domestic mill shipments to domestic locations plus imports. In the three months through June 2015 average monthly supply of sheet and strip was 4,616,769 tons, up by 1.3 percent from the previous three month period (January through March, 3M/3M). It was down by 5.5 percent from the same period last year and down by 3.3 percent YTD compared to the first six months of 2014. Table 2 shows the change in supply by product on the same basis through June.
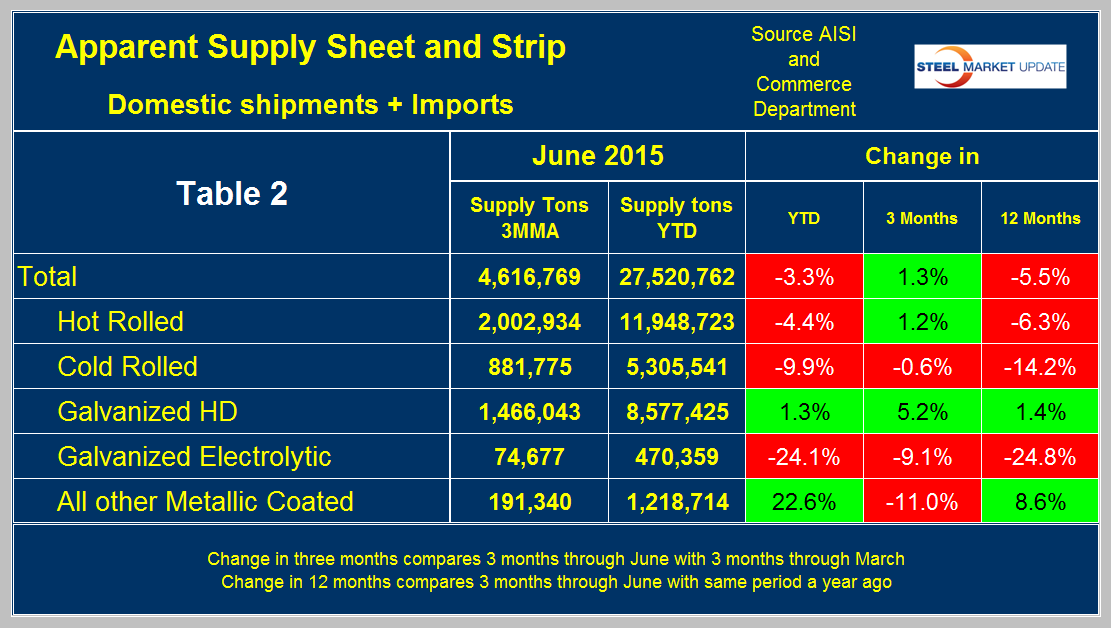
There is a big difference between products. Hot rolled followed the overall trend but cold rolled and coated products did not. Cold rolled declined in the 3M/3M comparison. HDG strengthened in all three time comparisons. Electro-galvanized was down by 24.1 percent YTD and in 3 months was down by 9.1 percent. The first half of 2014 was strong for EG then faded significantly. Results for other metallic coated were excellent YTD being up by 22.6 percent but that performance faded in Q2 with an 11 percent decline compared to Q1. The result for OMC was distorted by an unexplained huge volume of mill shipments in January 2015 plus imports that were above the current norm.
Figure 1 shows the long term supply picture for the three major sheet and strip products, HR, CR and HDG since January 2003 as three month moving averages.
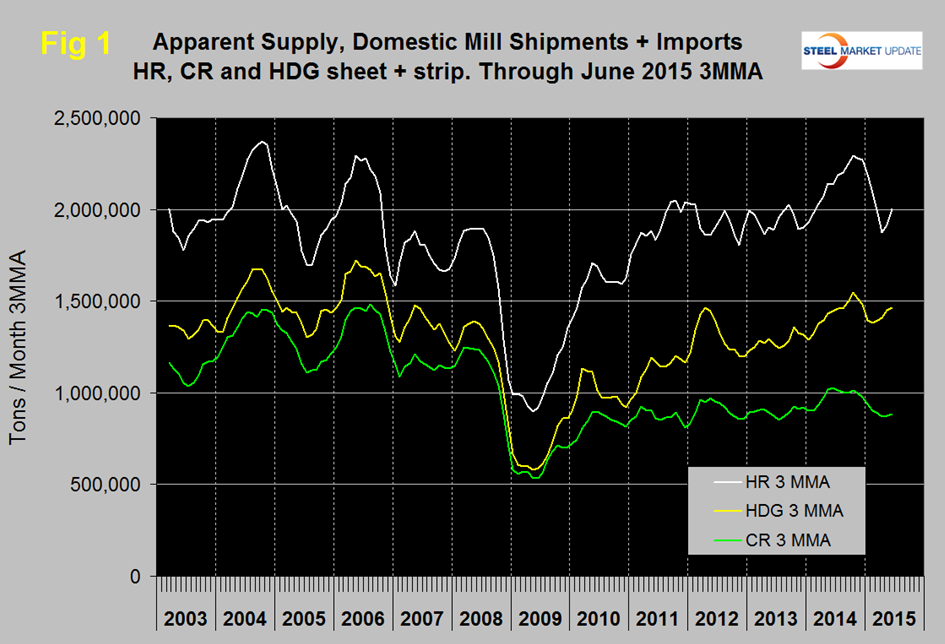
Hot rolled declined every month November through April then picked up in both May and June. Cold rolled also declined in November through April and picked up slightly in May and June. Hot dipped galvanized declined in the period November through February and has picked back up in each of the last four months. In Q4 2014 all three were in higher demand than at any time since the recession, that is no longer the case.
Figure 2 shows import market share of sheet products and includes long products for comparison.
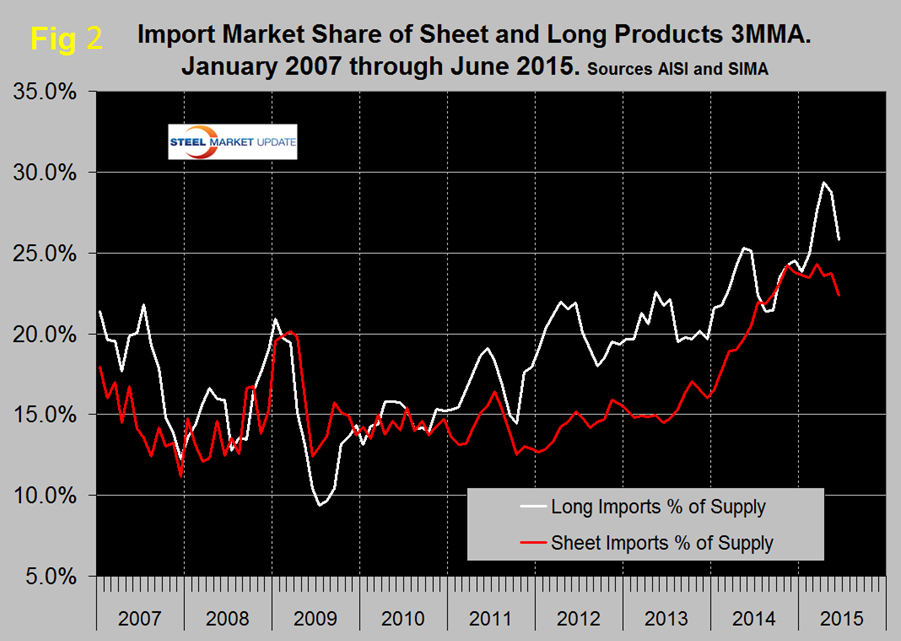
Based on a 3MMA the import market share of sheet products was 22.4 percent in June, down from 24.3 percent in March and the lowest share since September last year. The months March and November had the highest import market share since the beginning of the recovery. Import market share of long products in June was 25.8 percent, down from the peak of 29.4 percent in April.
Mill Shipments: Table 3 shows that total shipments of sheet and strip products including hot rolled, cold rolled and all coated products were down by 7.0 percent YTD year over year and up by 3.3 percent in 3 months through June compared to 3 months through March.
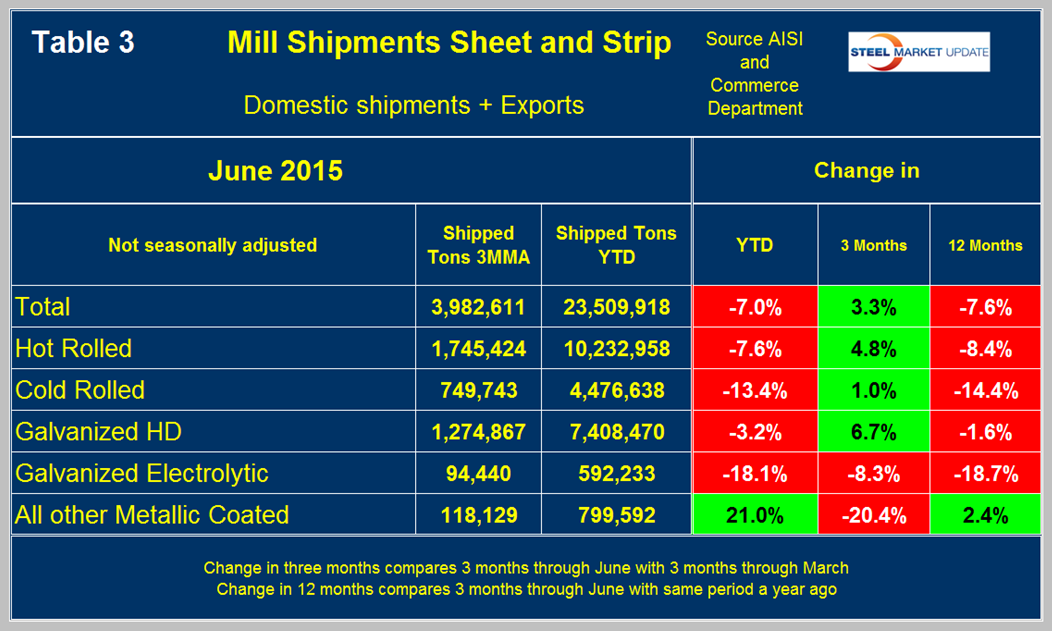
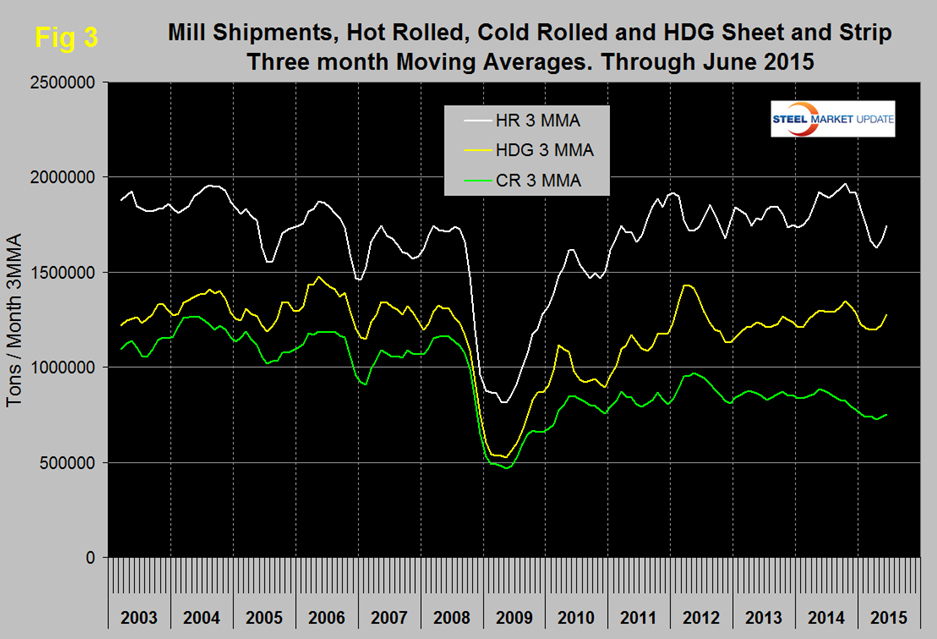
Three months through June year over year was down by 7.6 percent. Hot rolled, cold rolled and HDG followed the same pattern in all three time comparisons. Other metallic coated was down by 20.4 percent in 3 months through June compared to 3 months through March, this was mainly because of an extremely strong shipment volume in January as mentioned above. Figure 3 shows the history of mill shipments since January 2008.
SMU Comment: Import market share is still very high, longs being even worse than sheet products. Year over year mill shipments are declining faster than apparent supply a differential that is driven directly by import market share.


