Market Segment

August 19, 2015
Service Center Intake, Shipments and Inventory through July 2015
Written by Peter Wright
Based on Steel Market Update (SMU) analysis of the recently released MSCI service center inventory and shipment data, total service center carbon steel shipments decreased by 116,500 tons in July to 3.287 million tons. Shipping days at 22, were the same as June. On a tons per day basis (t/d) shipments decreased from 154,700 in June to 149,400 in July.
![]()
In the twelve years since 2004, July shipments on average have been down by 4.5 percent from June, this year shipments were down by 3.4 percent. May, June and July were the first months this year in which the shipment change month over month was better than the 12 year average. Therefore on a long term basis (12 years) what on the first glance was not a good shipping month did show a long term improving trend. This statement is not true for shorter time period comparisons nor for all individual products. Figure 1 demonstrates the seasonality of service center shipments and why comparing a month’s performance with the previous month is usually misleading. For this reason in the SMU analysis we always consider year over year changes.
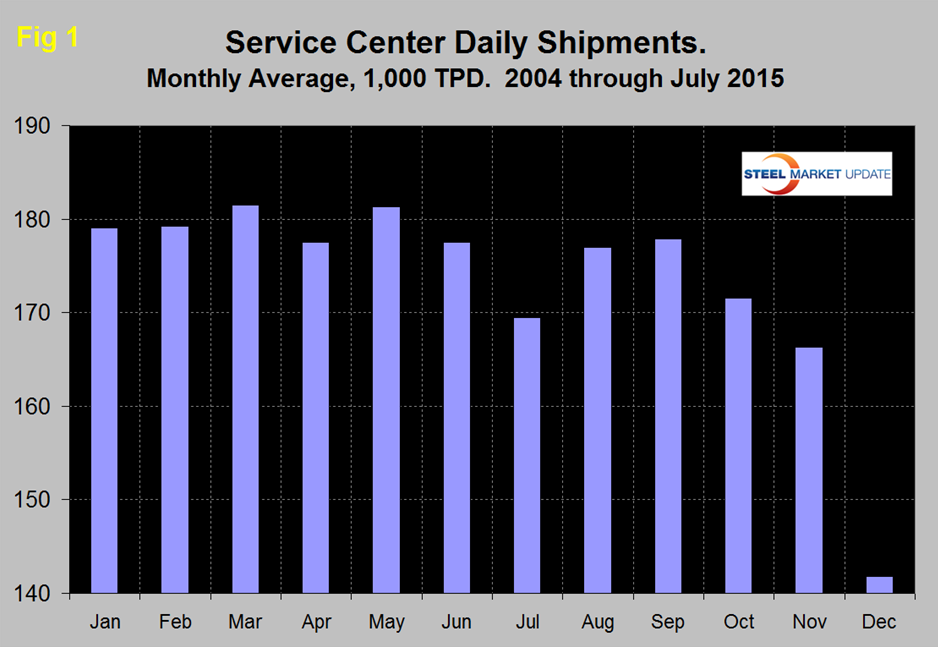
Table 1 shows the performance by product in July compared to the same month last year and also with the average t/d for July in the last three years. We then calculate the percent change between July 2015 and July 2014 and with the 3 year July average. We hope this give the best view of market direction.
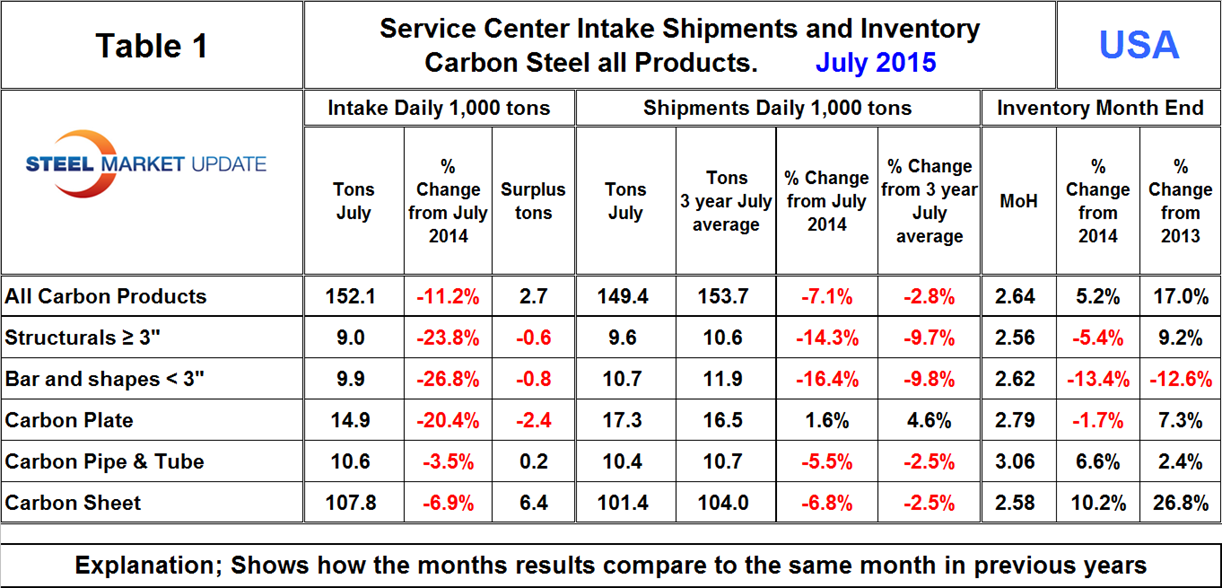
In July intake at 152,100 tons was 2,700 tons more than shipments. This broke a string of five straight months where intake has been less than shipments. Intake of long products and plate was less than shipments, the overall surplus was driven by sheet products for which surplus intake was 6,400 tons. Shipments of all products on a t/d basis were down by 7.1 percent from July last year and were 2.8 percent less than the average July shipments for 2015, 2014 and 2013. The fact that the single month growth comparison is worse than the three year comparison is an indication that momentum is negative and growth is slowing. Shipments of all products except plate were down year over year on a tons/day basis. Shipments of long products were particularly hard hit.
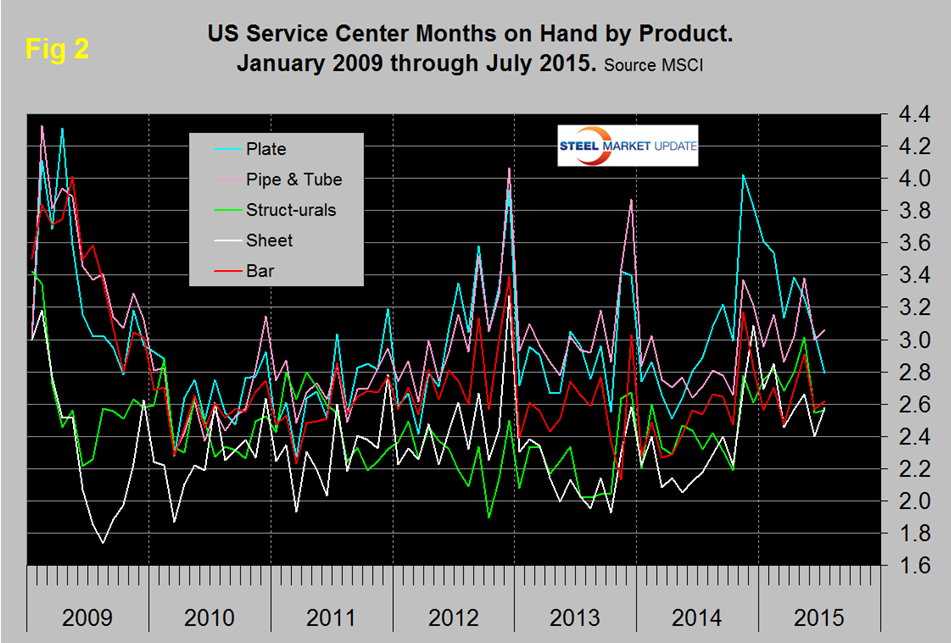
July closed with months on hand (MoH) at 2.64, up from 2.53 at the end of June and up from 2.33 at the end of July last year. Structurals, bars and plate had a y/y inventory decrease and sheet and tubulars had an inventory increase. Figure 2 shows the MoH by product monthly since January 2009. Plate has had a particularly strong inventory decline since the end of last year.
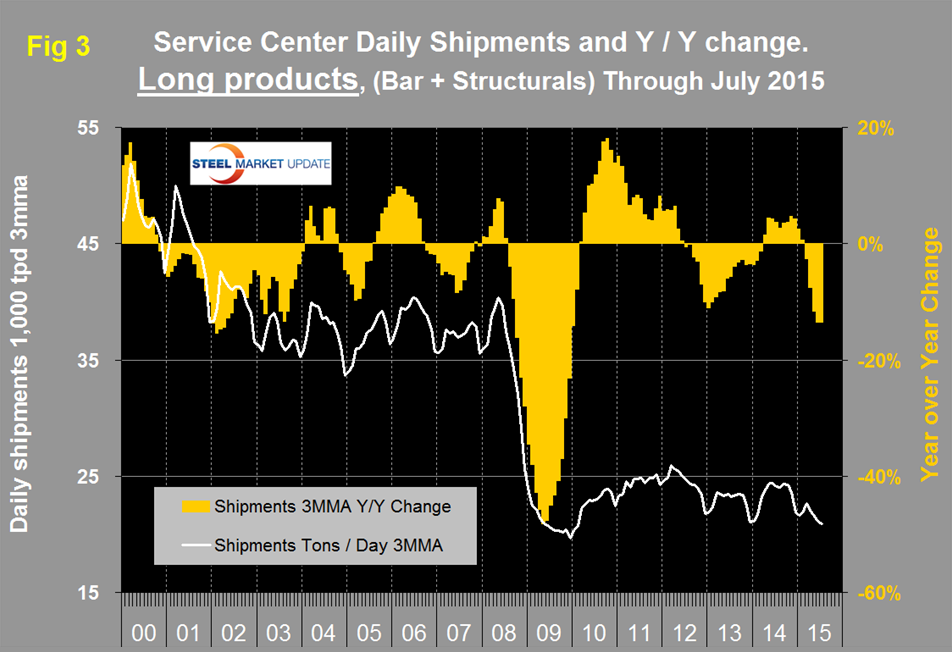
There continues to be a wide difference between the performances of flat rolled (sheet+plate) and long products (structurals+bar) at the service center level. Long products have had a very poor recovery from the recession. On a 3MMA basis y/y, the growth of shipments was negative for 21 straight months until April last year which was the first of eleven months of growth. However in March on a y/y basis shipment growth returned to negative territory at -2.6 percent followed by April at -7.6 percent, May at -11.6 percent, June at -13.5 and July at -13.5 percent (Figure 3).
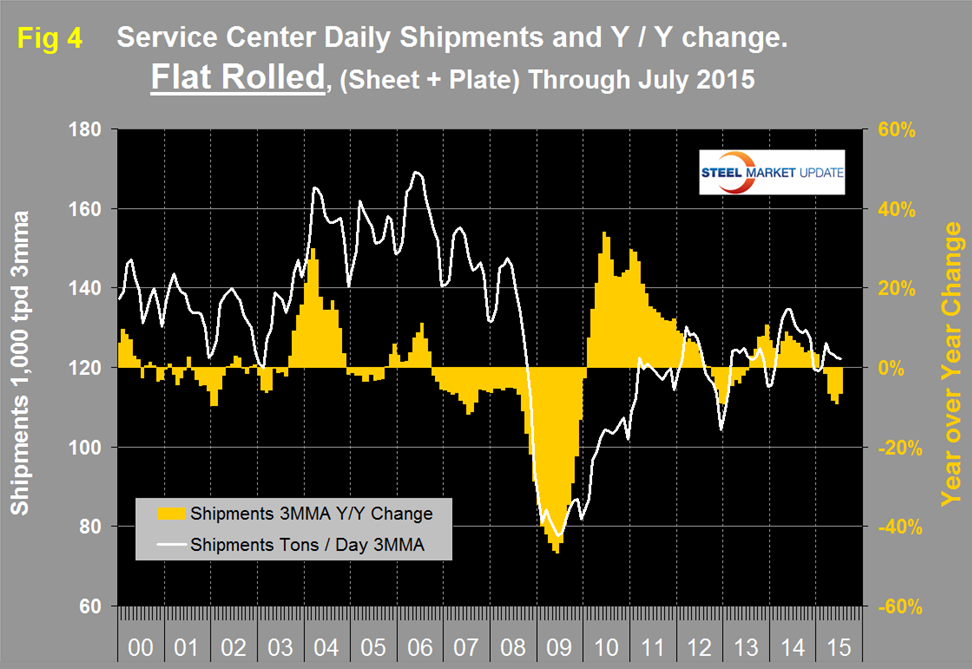
Flat rolled has had a much better recovery since mid-2009 and had positive y/y growth for 18 straight months through January this year. In February growth slowed to zero, in March came in at negative 1.6 percent followed by April at -6.6 percent, May at -8.3 percent, June at -9.1 and July at -6.6 percent (Figure 4).
In 2006 and 2007, the mills and service centers were operating at maximum capacity. Figure 5 takes the shipments by product since that time frame and indexes them to the average for 2006 and 2007 in order to measure the extent to which service center shipments of each product have recovered.
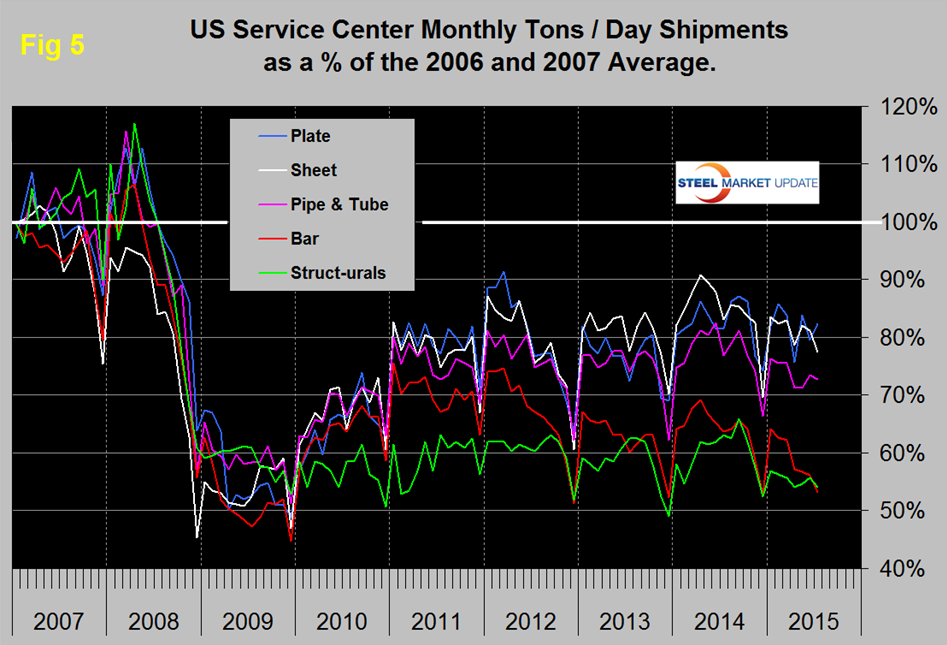
Again it can be seen that bar and structurals have the worst record. Sheet and plate have had the best recovery since the recession followed by tubulars. Even so the recovery of sheet is only at 77.5 percent and plate at 82.4 percent. The total of carbon steel products is now at 70.4 percent of the shipping rate that existed in 2006 and 2007, with structurals and bar at 54.1 percent and 53.2 percent respectively.
MSCI uses product nomenclature flat and plate. In this analysis at SMU we replace the term flat with sheet. By our interpretation of the MSCI’s data their definition of “flat” is all hot rolled, cold rolled and coated sheet products. Since most of our readers are sheet oriented we have removed plate from Figure 4 to highlight the history of sheet products which are shown in (Figure 6).
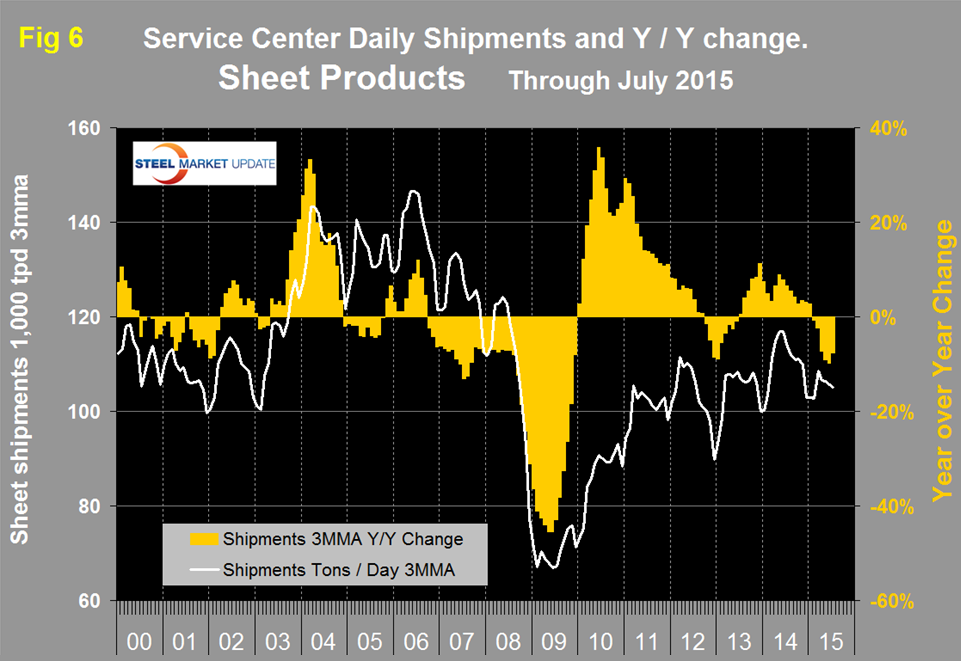
Following the strong post-recession recovery, sheet products experienced 9 months of decline from October 2012 through June 2013. This was followed by eighteen months of growth through January this year but February slipped back into negative territory at -0.7 percent year over year, the March result was -2.3 percent followed by April at -7.3 percent, May at -9.1 percent, June at -9.8 percent and July at -7.6 percent.
SMU Comment: Even though July shipments decreased less than the long term norm from June, this was not an encouraging report. The shipment data from the MSCI has indicated negative year over year growth every month since January this year. This analysis is in alignment with our reports of total supply to the market which is based on AISI shipment and import data. Total supply of hot rolled products was down in February through June (latest month available) compared to the last three quarters of 2014.
The SMU data base contains many more product specific charts than can be shown in this brief review. For each product we have ten year charts for shipments, intake, inventory tonnage and months on hand. Some readers have requested these extra charts for a particular product and others are welcome to do so.