

Market Data

August 30, 2015
Currency Update for Steel Trading Nations
Written by Peter Wright
The article below is normally reserved for our Premium members, we felt it would be good to share with our Executive members also.
We have two data sources for this report. These are the Federal Reserve and the Oanda forex trading platform. An explanation of these sources is given at the end of this report.
![]()
Oanda is current every day but the Federal Reserve Daily Broad Index (BI) is normally about eight days in arrears. As of August 29th the Fed’s latest daily update was August 21st, therefore it was eight days behind the individual steel trading currency data that we are presenting here. Figure 1 shows that the value of the US dollar, as recorded by the daily BI, had a recent low point of 114.1 on June 18th and has since had an uninterrupted surge to 119.76 on August 21st.
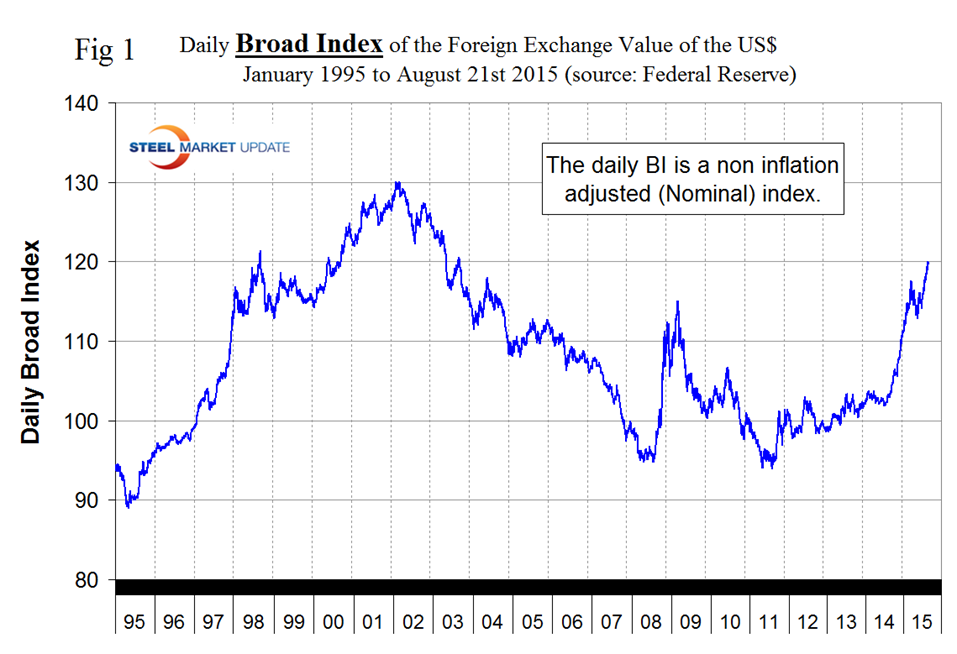
This is the dollar’s strongest value in almost 12 years as a flight to safety continues driven by fears and uncertainty about the global economy. The BI has appreciated by 4.9 percent in 3 months and 2.0 percent in the last month. The world is watching to see if the Fed will raise interest rates in September. When (not if) this happens it will drive the value of the dollar higher. On August 25th, Bloomberg News reported that Federal Reserve Bank of Atlanta President Dennis Lockhart said he continues to expect the first interest-rate hike in nearly a decade this year, while cautioning that a stronger dollar, a weaker Chinese yuan and falling oil prices complicate the outlook. “I expect the normalization of monetary policy —- that is, interest rates —- to begin sometime this year,” Lockhart said Monday in Berkeley, California, without citing a particular month. “Currently, developments such as the appreciation of the dollar, the devaluation of the Chinese currency, and the further decline of oil prices are complicating factors in predicting the pace of growth.” Lockhart declined to spell out if he favored moving in September or delaying liftoff. “I’m going to stick with later this year. We have three more meetings,” he told a Bloomberg reporter after delivering the speech. Lockhart said Aug. 10 that he thought liftoff was “close” and told reporters that “from my perspective September remains a live possibility.”
The Fed is in a tough spot; the domestic U.S. economy is looking progressively healthier and there are many arguments to suggest that the U.S. domestically could support a “token” rate hike. The Fed has virtually completed step one of its dual mandate, full employment. Its inflation target still requires some work. As long as commodity prices do not keep going south, they should eventually be able to tick off that box too. Data on Thursday showed that the U.S. economy grew much more quickly than first estimated in Q2, rising by +3.7 percent. U.S. exports to China represent only +1 percent of its GDP, meaning the direct impact of the Chinese economic woes is modest.
It does not necessarily follow that the steel trading currencies follow the BI. In the last three months the dollar has strengthened against 12 of the 16 steel trading nations that we examine in this report, in the last month it has also strengthened against 12 and in the last 7 days has strengthened against only eight.
Table 1 shows the number of currency units of steel trading nations that it takes to buy one US dollar and the change in one year, three months, one month and seven days. The table is color coded to indicate strengthening of the dollar in red and weakening in green.
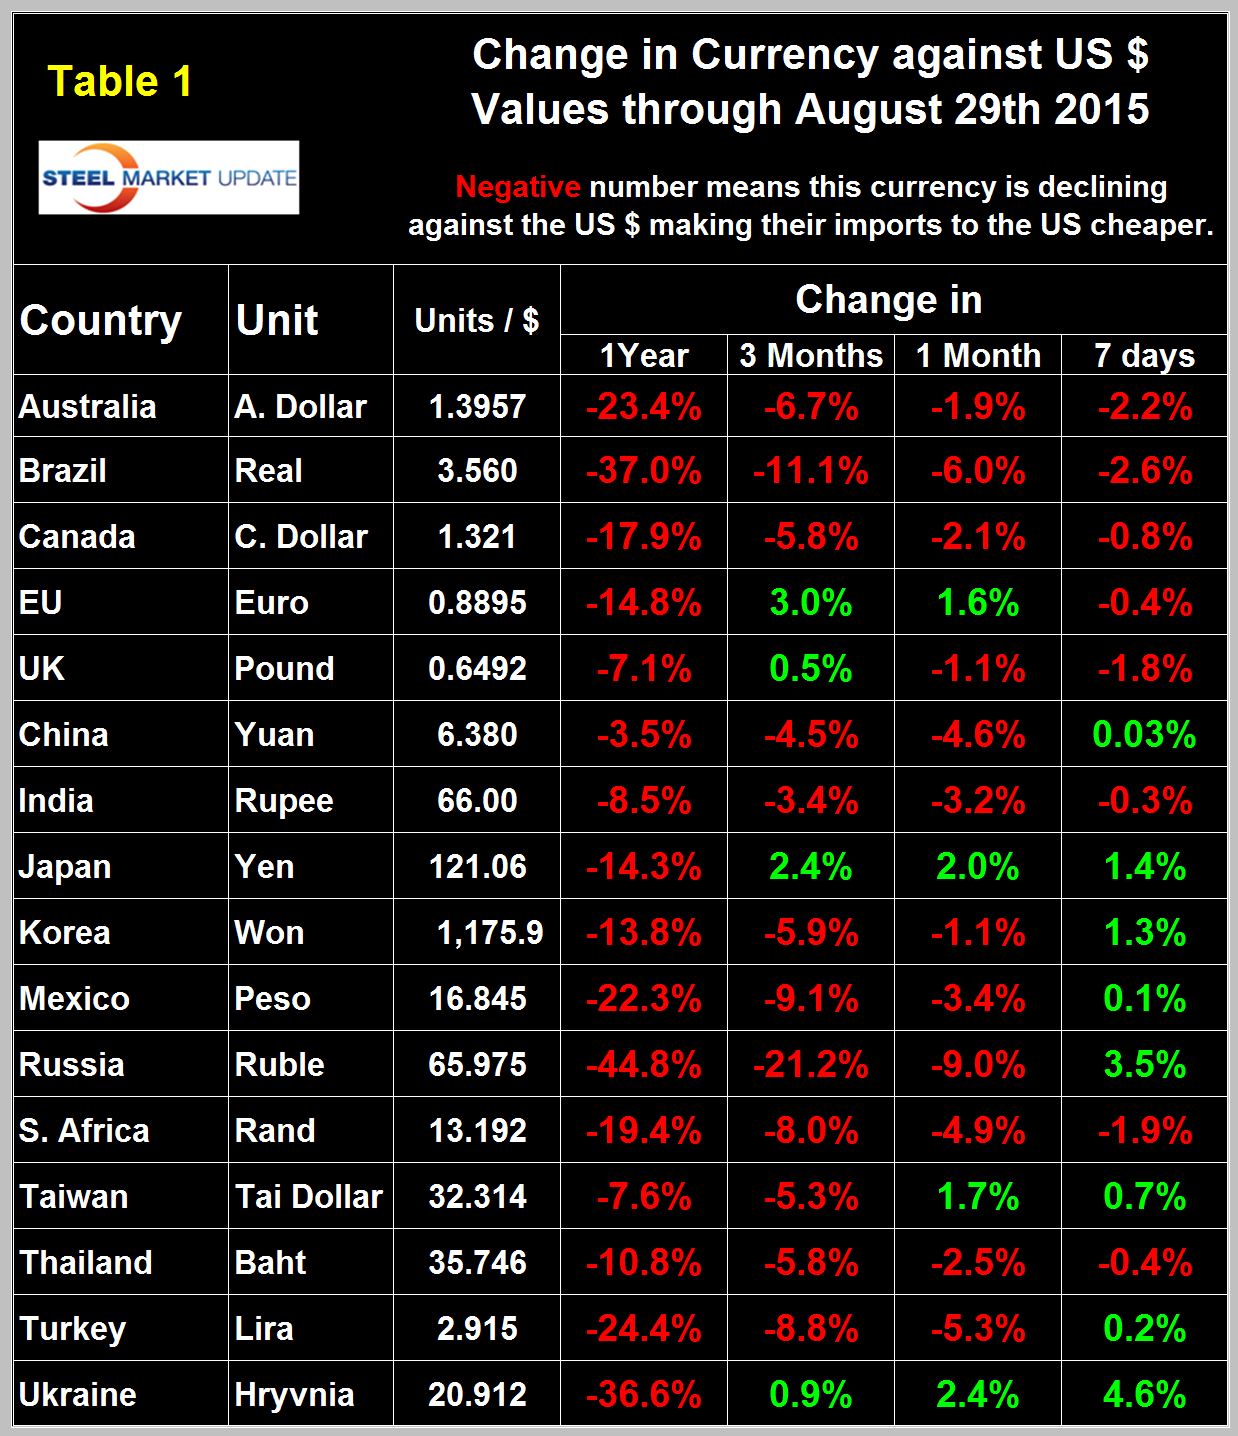
We regard strengthening of the US Dollar as negative and weakening as positive because the effect on net imports. In 2014, 25 percent of the U.S. economy was related to international trade, therefore, currency swings can have a huge effects on the economy in general and of the steel industry in particular. At the 12 month level the dollar has strengthened against every one of the steel trading currencies.
We have prepared a slide showing the depreciation of the currencies of the top eight steel importing nations to the US for inclusion in next week’s SMU conference in Atlanta and thought it worthwhile to include here (Table 2).
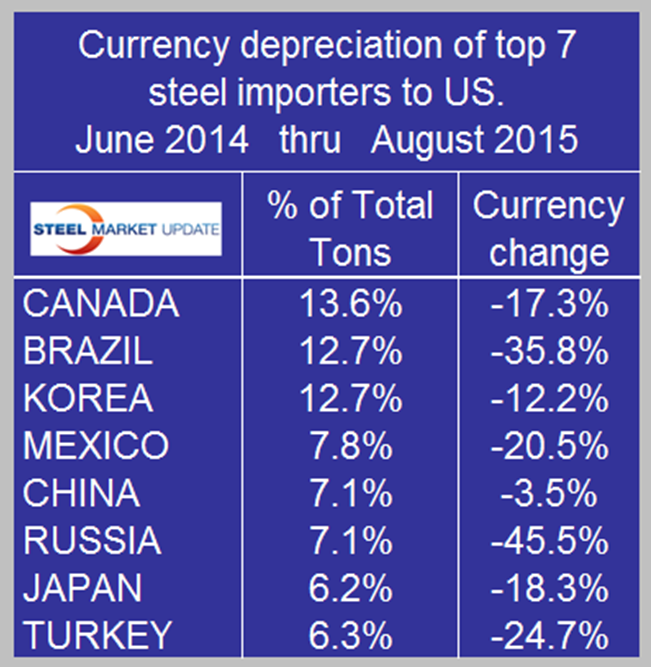
These eight nations accounted for 73.6 percent of all steel imports in the 15 months from June last year through August (licenses) this year. Canada at 13.6 percent of the total had the highest volume. Turkey at 6.3 percent was the lowest of the eight. All eight nations except China had double digit depreciation against the dollar in 15 months making their offerings that much more attractive to US buyers.
In each of these reports we comment on a few of the 16 steel trading currencies but charts for each are available through August 11th for any reader who requests them.
The Chinese Yuan. Depreciation against the dollar has amounted to 4.6 percent in the last month and zero in the last seven days (Figure 2).
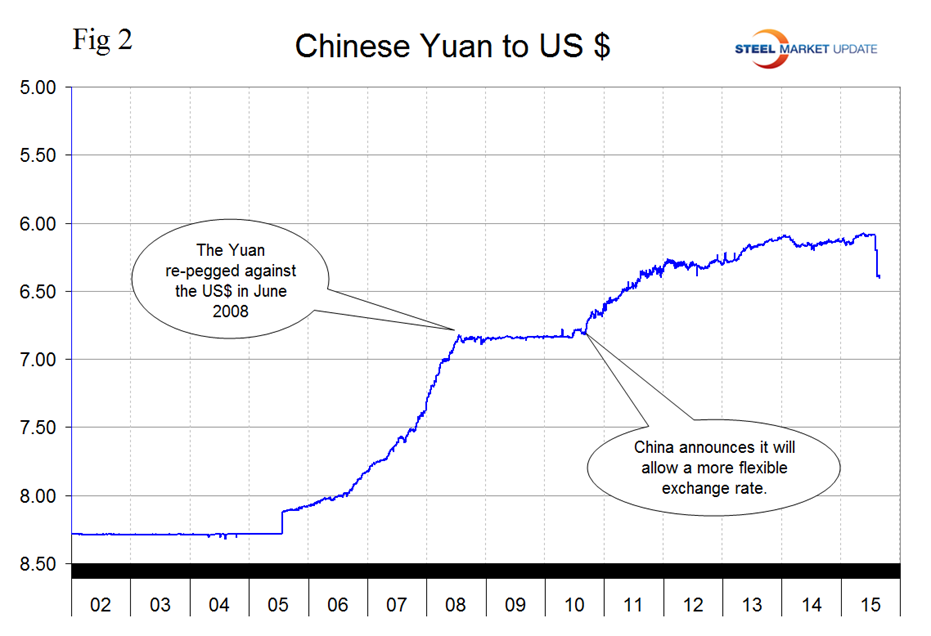
One immediate problem for the US Federal reserve’s monetary policy deliberations is the uncertainty about how serious the Chinese downturn will turn out to be. Chinese leadership is being tested, as investors seem to be losing confidence in them and continue to want to cash out as doubts over the effectiveness of Government policies grows.
One of the issues influencing the recent depreciation of the Yuan is the IMFs insistence that for the Chinese currency to be included in the basket of currencies that comprise the SDR (Special Drawing Rights) it must not be pegged to the US dollar. The SDR is an international reserve asset, created by the IMF in 1969 to supplement its member countries’ official reserves. Its value is based on a basket of four key international currencies, and SDRs can be exchanged for freely usable currencies.
On August 20th Lawrence Williams wrote the following in Seeking Alpha: In an announcement today, the IMF Executive Board has confirmed the previously-suggested extension of the current SDR basket of currencies by nine months from December 31 this year up until September 30th next. This leaves the way open for changes to be made, and implemented, in the structure of the SDR basket for a revised basket (if so chosen) to be implemented in October 2016. Normally the IMF would review, and restructure if it chooses to do so, the SDR basket every five years which would have made this process due to be announced in October this year, and implemented at the beginning of next. However, the extension is undoubtedly due to internal arguments over the inclusion of the Chinese renminbi, and the delay gives the Chinese time to meet some of the requirements of key IMF board members (the USA?) which have almost certainly already led to China’s recent renminbi devaluation against the U.S. dollar. This may at least give it the appearance of no longer being tied directly to the greenback with which it had been in lockstep for a number of years. Whether China will allow a full float of the renminbi on the global currency markets remains to be seen – this may be a step too far, and perhaps also an over-worrying move if implemented for some IMF board members (the USA again?)
The Euro had a recent low of 1.050 on March 16th, then recovered to 1.1452 on May 18th and has been range bound since then with a recent uptick (Figure 3).
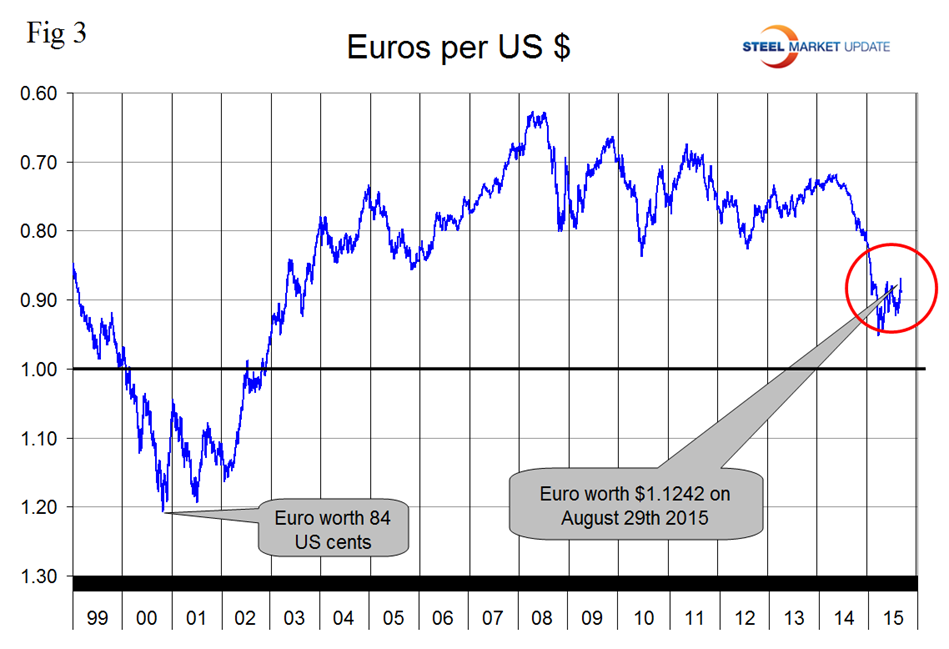
Against the US dollar, the Euro has declined by 14.8 percent in one year but has appreciated by 3.0 percent in 3 months and by 1.6 percent in one month.
The Russian Ruble had an all-time low of 70.035/US $ on February 2nd, recovered to 49.17 on May 18th, fell to another all-time low of 70.599 on August 25th and has since recovered to 65.96 on August 29th (Figure 4).
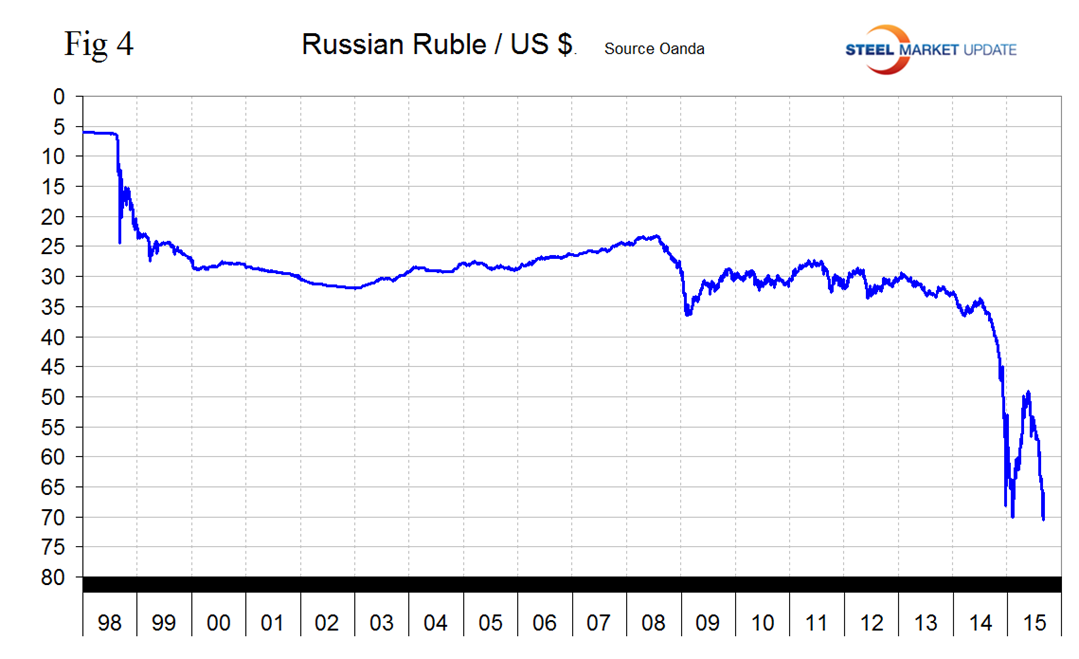
Barry Bourgeault wrote this week: Russia has attempted to do a couple of things in order to deal with the oil crisis and the falling ruble. One was for the Central Bank of Russia to further cut its interest rates in July, when it was lowered by 50 basis points to 11 percent. That follows a number of interest rate cuts which the central bank has initiated since December 2014, when it stood at 17 percent. Moscow recently said it will attempt to strengthen the ruble via an increase in foreign currency sales, according to Reuters. This isn’t considered the best available option to reverse the downward trajectory of the ruble. It has also renewed speculation the government may once again order its state-owned exporters to boost “their own foreign currency sales,” as they were forced to in December. No matter what the steps Russia takes to alleviate the downward trend of the ruble, its fate and performance is primarily tied to the price of oil. That is the metric to watch in determining its direction.
The Australian $, the Canadian $ and the Brazilian Real have declined by 6.7 percent, 5.8 percent and 11.1 percent respectively in the last three months and by 1.9 percent, 2.1 percent and 6.0 percent in the last month. These currencies have been dragged down by depressed commodity prices and have been under pressure from flight to quality trading strategies.
The Mexican Peso declined abruptly at the end of last year and more steadily though erratically ever since to close at 16.84 on August 29th (Figure 5).
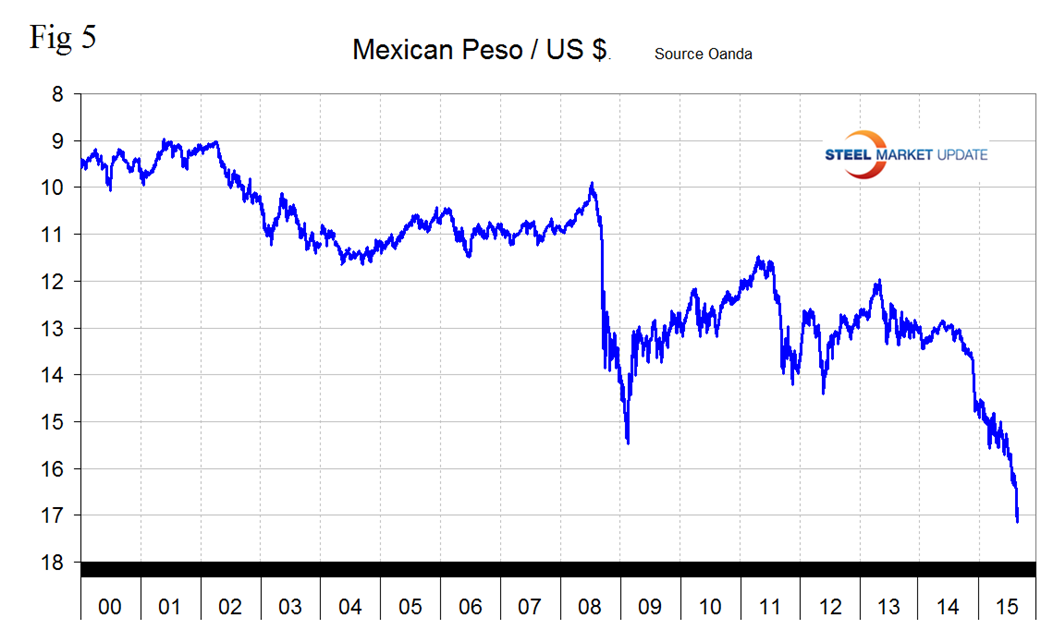
The peso is down by 22.3 percent in 12 months and by 3.4 percent in the last month. Bloomberg Business reported on August 13th, “Mexican policy makers probably will raise the benchmark overnight rate this quarter for the first time since 2008 as the Federal Reserve increases U.S. borrowing costs, according to the median forecasts in Bloomberg surveys. Mexico’s central bank is concerned a smaller rate advantage versus the U.S. could prompt investors to pull money out of Latin America’s second-largest economy. Gross domestic product will expand 1.7 percent to 2.5 percent this year, down from the previous estimate of 2 percent to 3 percent, and inflation will remain below the 3 percent goal, the central bank said in its quarterly report Wednesday. Governor Agustin Carstens said that although domestic factors point to leaving rates on hold, decisions will depend on how markets and the peso, already trading near a record low, react to an imminent increase by the Federal Reserve.”
The Turkish Lira continues to plunge and will soon require an axis correction to Figure 6.
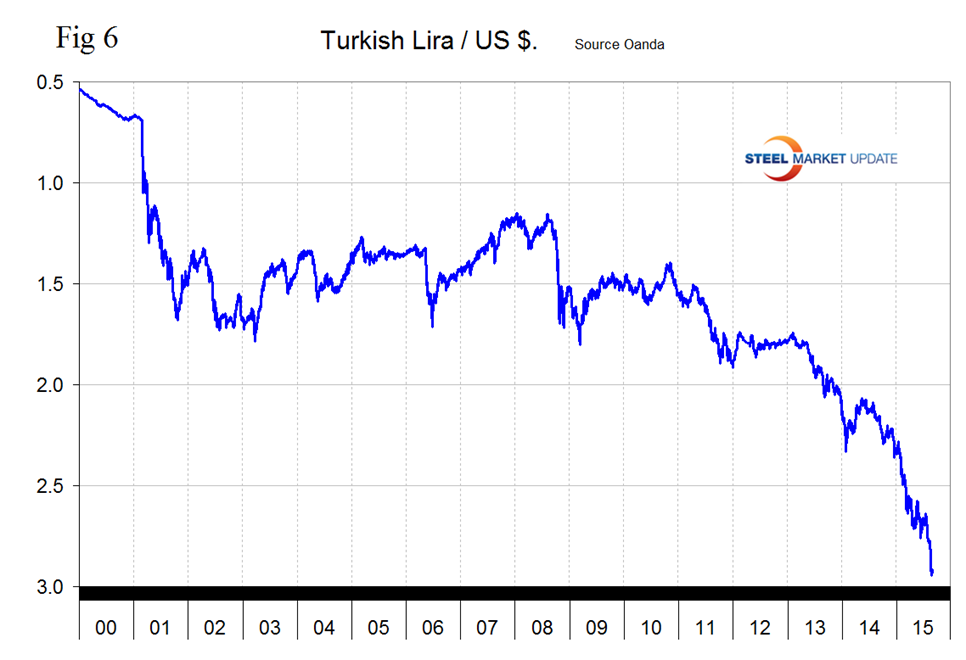
The Lira is down by 24.4 percent in 12 months, 8.8 percent in 3 months and by 5.3 percent in 30 days.
The Japanese Yen has made a small comeback in the last three weeks. On August 7th it had an eight year low of 124.77/US $ and recovered to 121.06 on August 29th (Figure 7).
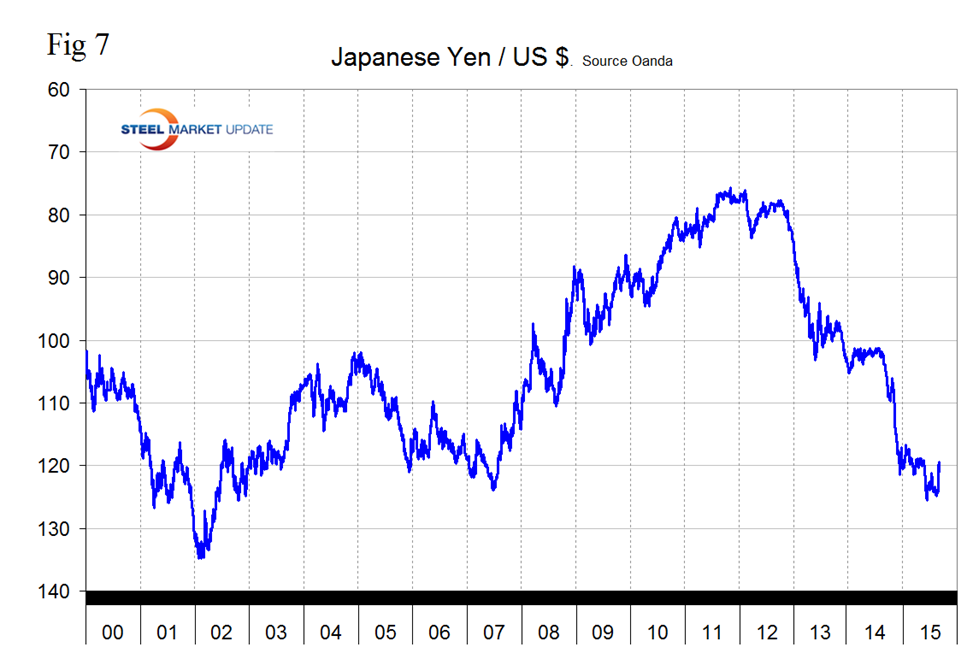
The Yen is down by 14.3 percent in one year but up by 2.4 percent in three months.
SMU Comment: The dollar actually weakened against 8 of the 16 steel trading currencies in the last 7 days as fears about what China would do next subsided. Based on the trajectory of the broad index and on expectations of a rate increase, if not in September at least before the year end, we expect the dollar to continue to strengthen. The currency trends will continue to attract imports and suppress both exports and raw materials prices.
Explanation of Data Sources: The broad index is published by the Federal Reserve on both a daily and monthly basis. It is a weighted average of the foreign exchange values of the U.S. dollar against the currencies of a large group of major U.S. trading partners. The index weights, which change over time, are derived from U.S. export shares and from U.S. and foreign import shares. The data are noon buying rates in New York for cable transfers payable in the listed currencies. At SMU we use the historical exchange rates published in the Oanda Forex trading platform to track the currency value of the US $ against that of sixteen steel trading nations. Oanda operates within the guidelines of six major regulatory authorities around the world and provides access to over 70 currency pairs. Approximately $4 trillion US $ are traded every day on foreign exchange markets.


