

Market Data

September 11, 2015
Oil and Gas Prices and Rotary Rig Count Analysis
Written by Peter Wright
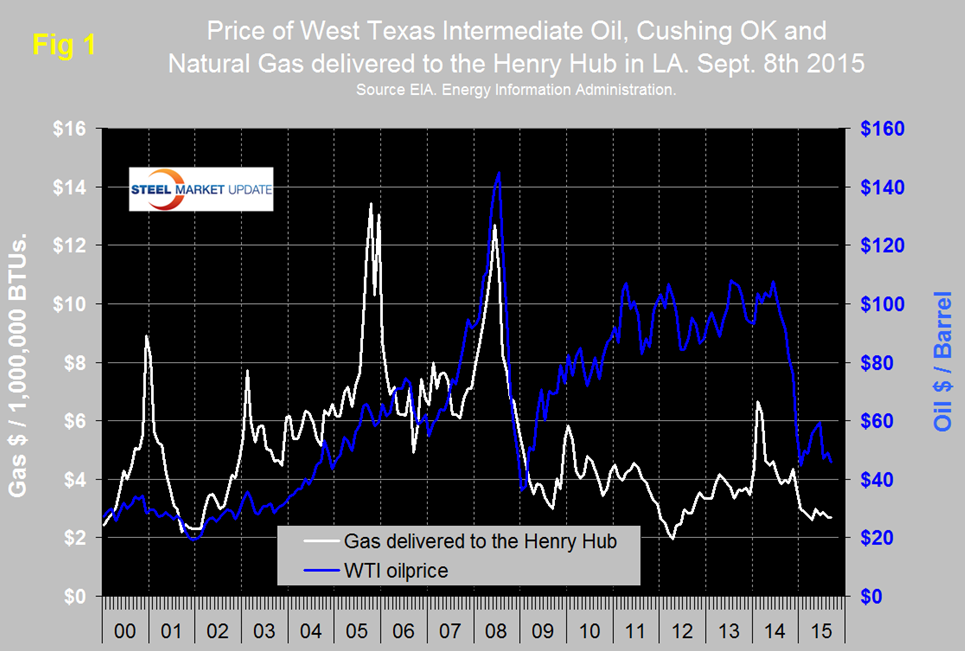
Figure 1 shows historical gas and oil prices since January 2000. The daily spot price of West Texas Intermediate closed at $45.92 on September 8th after recovering to $59.53 on June 15th. In the last 10 days WTI has declined by $3.28 according to the latest daily figure available from the Energy Information Administration (EIA). Brent closed at $48.88 on the same day.
From Global Risk Insights September 11th, “Once the indisputable ruler of oil markets, the OPEC cartel is under great pressure to revise its current policy as low oil prices are starting to hurt oil exporters’ economies and threaten to split the Organization apart. The past five years have completely changed oil market flows. With US production increasing and oil imports rapidly declining, many oil exporters such as Nigeria, Libya, Algeria, and Angola were completely locked out of the American market. Others, like Saudi Arabia, are fighting hard to retain their global market share by continuing to pump vast quantities of oil. How successful has this strategy been since it was introduced in October 2014? In terms of market share, the cartel succeeded in retaining traditional markets, but at a heavy price for its revenues. Another goal – to suffocate the US shale industry with low prices – brought mixed results, and in the long term it will probably fail. The US producers were forced to cut capital spending and significantly lower their break-even prices. Nonetheless, US producers are still succeeding in keeping their heads above the water, even with the prices as low as $40 per barrel of the WTI traded oil. In addition, the sudden drop in prices helped the industry to consolidate, both in terms of productivity and cost efficiency, and although some of the production will inevitably become unsustainable, the core areas can continue to pump oil at a profit with prices as low as $30 per barrel. The Saudis took a gamble, but it seems that the calculation was misleading. The final result could be not only a loss in revenues, but also a major split between the rich Gulf States, and the less fortunate ones – the African and Latin American states, Iran, Iraq, and Libya – and consequently the end of OPEC as we know it today. In the current climate it is hard to foresee oil prices bouncing back to previous levels. Considering that the markets are still oversupplied with around 3 million barrels per day, and that Iran’s production is expected to beef up the glut by another 400-600,000 barrels per day, the period of low prices may continue for several more years.”
Natural gas delivered to the Henry Hub in Louisiana has been hovering in a fairly narrow range all year, with a slight downward trend to close at $2.69 on September 4th. U.S. power stations are now reported to be generating more power from natural gas than from coal for the first time ever. The price of natural gas has never recovered from the collapse that occurred during the recession and was followed in late 2008 by a rapid decline in the gas rig count. After a partial recovery in 2011 and 2012 the decline in the gas rig count has continued. The collapse in the oil rig count didn’t begin until October 10th last year following the oil price decline that began in June last year. Figure 2 shows the Baker Hughes US Rotary Rig Counts for oil and gas equipment.
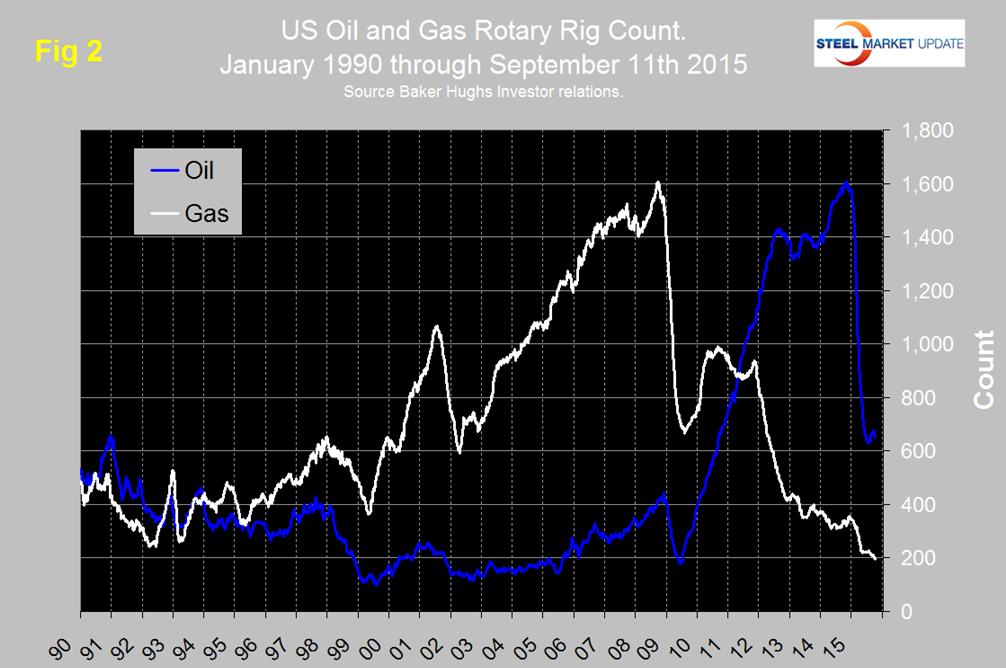
These are a weekly census of the number of drilling rigs actively exploring for or developing oil or natural gas in the United States. Rigs are considered active from the time they break ground until the time they reach their target depth and may be establishing a new well or sidetracking an existing one. The Baker Hughes Rotary Rig count includes only those rigs that are significant consumers of oilfield services and supplies. The total number of operating rigs in the US and Canada on September 11th was 1033, an increase of 80 since the low point on May 22nd this year but down by 55.8 percent year over year. The US at 848 was down by 64 in the last month and Canada at 185 was down by 23. On a regional basis in the US the big three states for operating rigs are Texas, Oklahoma and North Dakota. Texas at 366 on September 11th was down by 16 in the last month, Oklahoma at 106 was down by one and North Dakota at 70 was also down by one. Figure 2 shows that there has been a slight uptick in oil rigs since the low point of June 26th but the gas rig count continues to decline and is now below 200 for the first time since our data stream began in January 2008.
Steel Market Update’s view is that based on all we read, low oil prices could be with us for a while. The industry will settle into a new norm and continued high levels of US oil production will mitigate the current reduction in energy related demand for steel products.


