

Market Data

September 14, 2015
Producer Price Indexes of Sheet Steel, Aluminum, Plastic and Transportation - August 2015
Written by Peter Wright
Each month the Bureau of Labor Statistics (BLS) puts out its series of producer price indexes, for thousands of goods and materials. For an explanation of this program see the end of this piece. The latest release last Friday reported results through August. We run this analysis every three or four months to give readers an opportunity to become aware of any changes in the competitive position of steel against other materials and rail vs truck transportation.
![]() The PPI data are helpful in monitoring the price direction of steel and steel products against competing materials and products. As far as we at SMU can tell from comparison with known transaction prices, these PPI are a good representation of the real world. However our observation is that the actual values of the PPIs of different products cannot be compared with one another because they are developed by different committees within the BLS. We believe that this data is useful only in comparing the direction of prices in the short and medium term.
The PPI data are helpful in monitoring the price direction of steel and steel products against competing materials and products. As far as we at SMU can tell from comparison with known transaction prices, these PPI are a good representation of the real world. However our observation is that the actual values of the PPIs of different products cannot be compared with one another because they are developed by different committees within the BLS. We believe that this data is useful only in comparing the direction of prices in the short and medium term.
The August report from the BLS has been abridged by SMU staff as follows; The Producer Price Index for final demand was unchanged in August, seasonally adjusted. Final demand prices rose 0.2 percent in July and 0.4 percent in June. On an unadjusted basis, the final demand index moved down 0.8 percent for the 12 months ended in August, the seventh straight 12-month decline. In August, a 0.4-percent increase in the index for final demand services offset a 0.6-percent decrease in prices for final demand goods. Within intermediate demand, prices for processed goods moved down 0.6 percent, the index for unprocessed goods fell 4.4 percent, and prices for services advanced 0.7 percent. The 0.6 percent decline in final demand goods in August was the largest decline since April. The August decrease is mostly attributable to a 3.3 percent drop in prices for final demand energy.
Product Detail: Accounting for nearly two-thirds of the decline in the final demand goods index, prices for gasoline fell 7.7 percent. The indexes for jet fuel, grains, iron and steel scrap, home heating oil, and light motor trucks also moved lower. Prices for residential natural gas and for search, detection, navigation, and guidance systems and equipment increased.
For the purpose of this report, we at SMU have extracted comparative statistics for sheet steel, aluminum and plastic products and truck and rail transportation. Table 1 is a summary of each category on a year over one, two and three year basis.
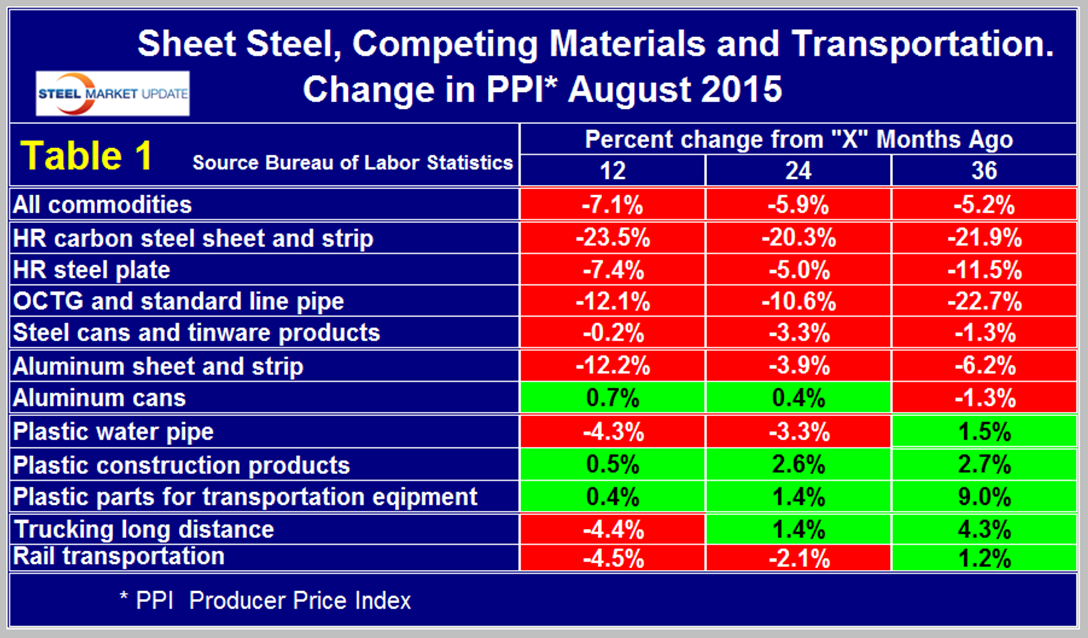
Our analysis of the PPI data shows that commodity prices as a whole declined by 7.1 percent in 12 months through August and were also down on a two and three year comparison. The decline on this basis is accelerating. In fact commodity prices were back to where they were over four years ago in January 2011. A rising $ will put downward pressure on commodity prices and the demand side of the equation is exacerbating currency effects at this time. Of particular interest in this analysis is that the decrease in price of both steel and aluminum cans bears no relationship to their raw sheet products. In fact aluminum cans have increased in price in the last 12 and 24 months. In a similar vein the prices of plastic construction products and plastic parts for transportation equipment have increased in the face of the declining oil price. In the last 12, 24 and 36 month periods hot rolled steel sheet and strip have declined in price by much more than aluminum sheet and strip (not good for Ford!).
Table 1 also shows price changes for truck and rail transportation and indicates that both modes have declined by the same amount in the last 12 months.
The official description from the BLS reads as follows: The Producer Price Index (PPI) is a family of indexes that measure the average change over time in the prices received by domestic producers of goods and services. PPIs measure price change from the perspective of the seller. This contrasts with other measures, such as the Consumer Price Index (CPI). CPIs measure price change from the purchaser’s perspective. Sellers’ and purchasers’ prices can differ due to government subsidies, sales and excise taxes, and distribution costs. More than 9,000 PPIs for individual products and groups of products are released each month. PPIs are available for the products of virtually every industry in the mining and manufacturing sectors of the U.S. economy. New PPIs are gradually being introduced for the products of industries in the construction, trade, finance, and services sectors of the economy. More than 100,000 price quotations per month are organized into three sets of PPIs: (1) Stage-of-processing indexes, (2) commodity indexes, and (3) indexes for the net output of industries and their products. The stage-of processing structure organizes products by class of buyer and degree of fabrication. The commodity structure organizes products by similarity of end use or material composition. The entire output of various industries is sampled to derive price indexes for the net output of industries and their products.


