

Market Data

September 14, 2015
Shipments and Supply of Sheet Products through July 2015
Written by Peter Wright
This report compares domestic mill shipments and total supply to the market. It quantifies market direction by product and enables a side by side comparison showing the degree to which imports have absorbed demand. Sources are the American Iron and Steel Institute and the Department of Commerce with analysis by SMU. Table 1 shows both supply and mill shipments of sheet products (shipments includes exports) side by side as a three month average for the periods May through July for both 2014 and 2015.
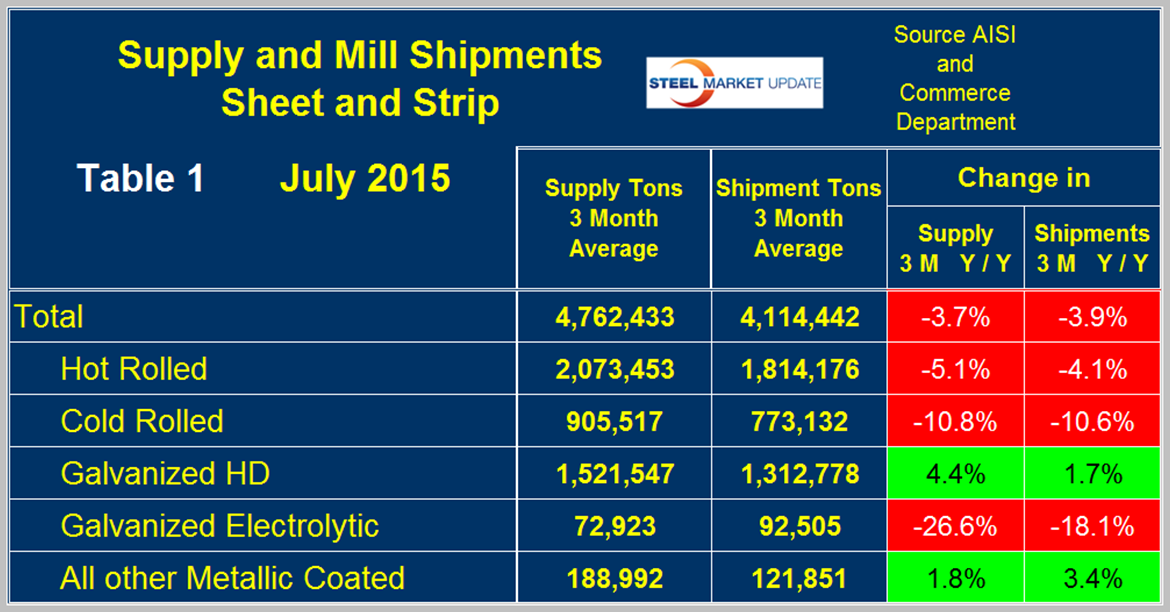
Comparing these two periods total supply to the market was down by 3.7 percent and shipments were down by 3.9 percent. These numbers are coming into line after the recent months in which imports fared much better than mill shipments. Table 1 breaks down the total into the individual sheet products. Supply of hot rolled was down by 5.1 percent and shipments were down by 4.1 percent which was a turnaround from the recent past and indicates that imports gave up some ground. Cold rolled was more or less in balance and HDG enjoyed an increase in both supply and mill shipments. Electro-galvanized which enjoys a trade surplus had a greater decline in supply than it did in shipments. Other metallic coated products (mainly Galvalume) enjoyed a 1.8 percent increase in supply and a 3.4 percent increase in mill shipments. A review of supply and shipments separately for individual sheet products is given below.
It is evident as we write many of the reports for publication in the Steel Market Update newsletters that it’s possible to slant an analysis anyway we want based on the time periods being concerned. For that reason we always provide tabular data with short time period comparisons as well as graphical analysis of a much longer time frame. We hope this gives you the reader the best picture of what is going on though as we write sometimes our comments can sound contradictory even to ourselves.
Apparent Supply is a proxy for market demand and is defined as domestic mill shipments to domestic locations plus imports. In the three months through July 2015 average monthly supply of sheet and strip was 4,762,433 tons, up by 7.8 percent from the previous three month period, February through April (3M/3M), down by 3.7 percent from the same period last year and down by 3.4 percent YTD compared to the first seven months of 2014. Table 2 shows the change in supply by product on the same basis through July.
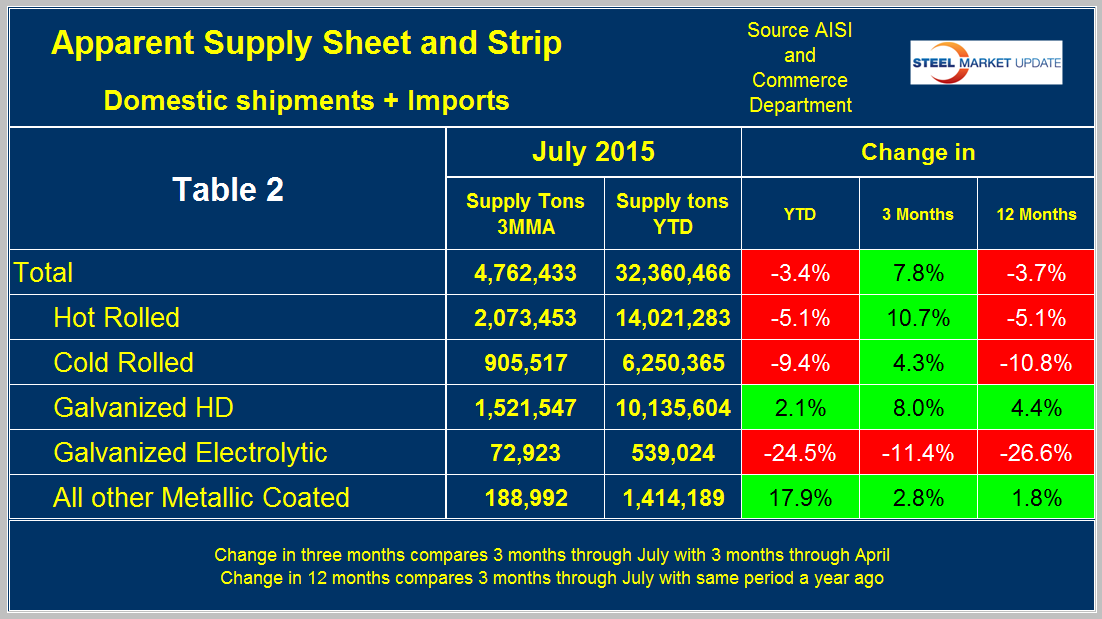
There is a big difference between products. Hot rolled and cold rolled followed the overall trend with an improvement in the 3M/3M comparison and a deterioration Y/Y and YTD. HDG and Galvalume marched to a different drum with positive growth in all three time comparisons. Electro-galvanized had negative growth in all three time comparisons.
Figure 1 shows the long term supply picture for the three major sheet and strip products, HR, CR and HDG since January 2003 as three month moving averages.
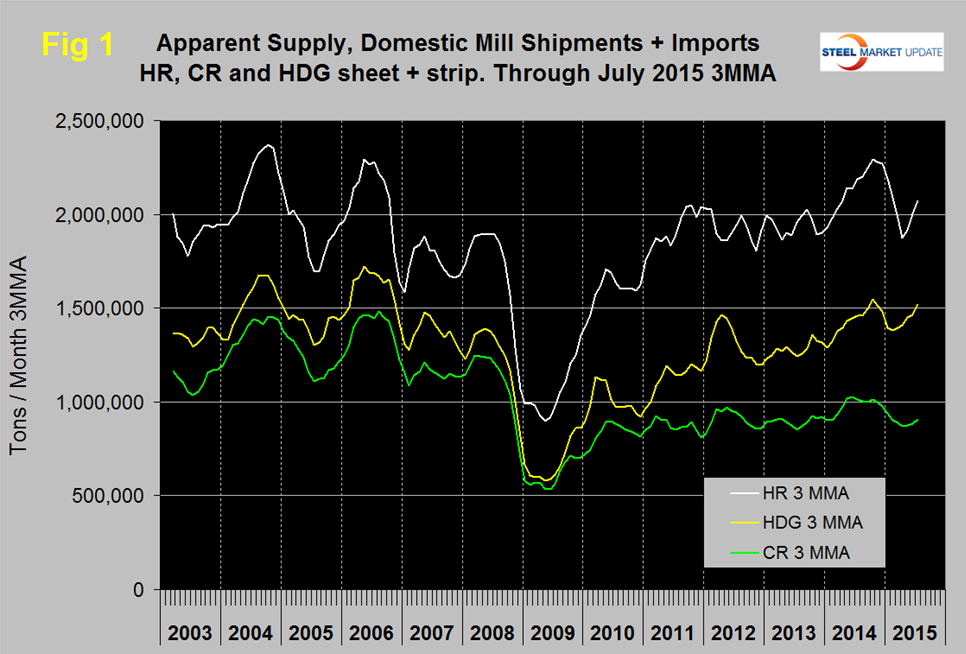
Hot rolled declined every month November through April then picked up in May, June and July. Cold rolled also declined in November through April and picked up slightly in May, June and July. Hot dipped galvanized declined in the period November through February and has picked back up in each of the last five months. In Q4 2014 all three were in higher demand than at any time since the recession that is no longer the case for hot and cold rolled but HDG is almost back to that situation.
Figure 2 shows import market share of sheet products and includes long products for comparison.
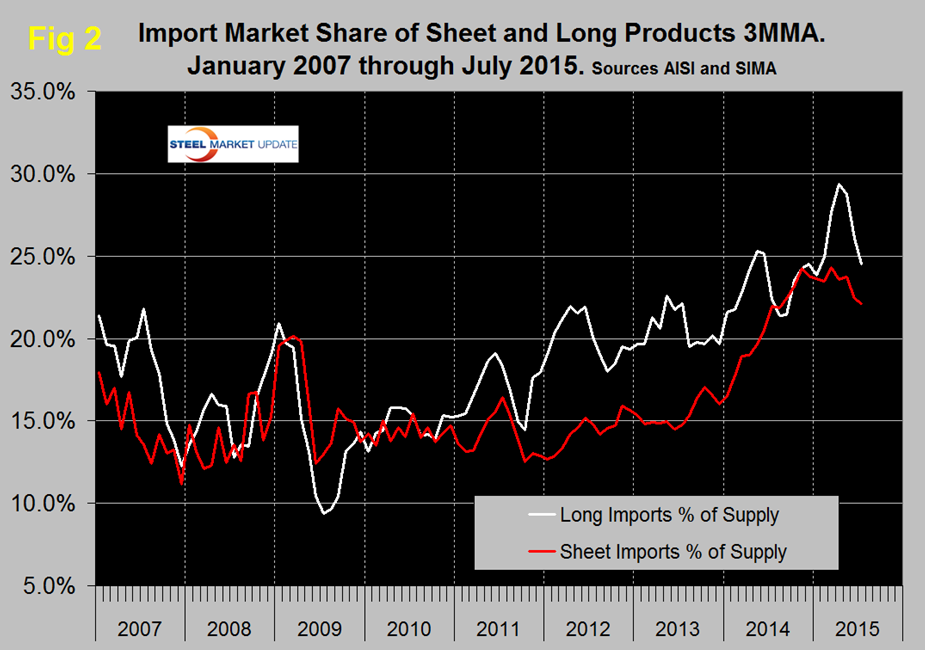
Based on a 3MMA the import market share of sheet products was 22.1 percent in July, down from 24.3 percent in March and the lowest share since August last year. The months March and November had the highest import market share since the beginning of the recovery. Import market share of long products in July was 24.5 percent, down from the peak of 29.4 percent in April this year.
Mill Shipments: Table 3 shows that total shipments of sheet and strip products including hot rolled, cold rolled and all coated products were down by 6.4 percent YTD year over year but up by 9.1 percent in 3 months through July compared to 3 months through April.
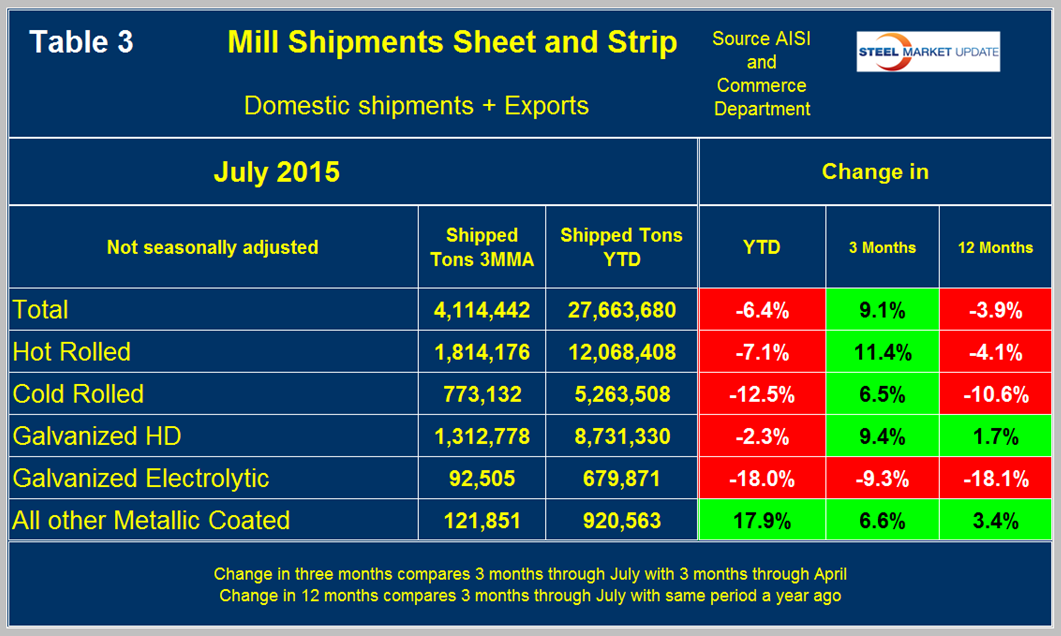
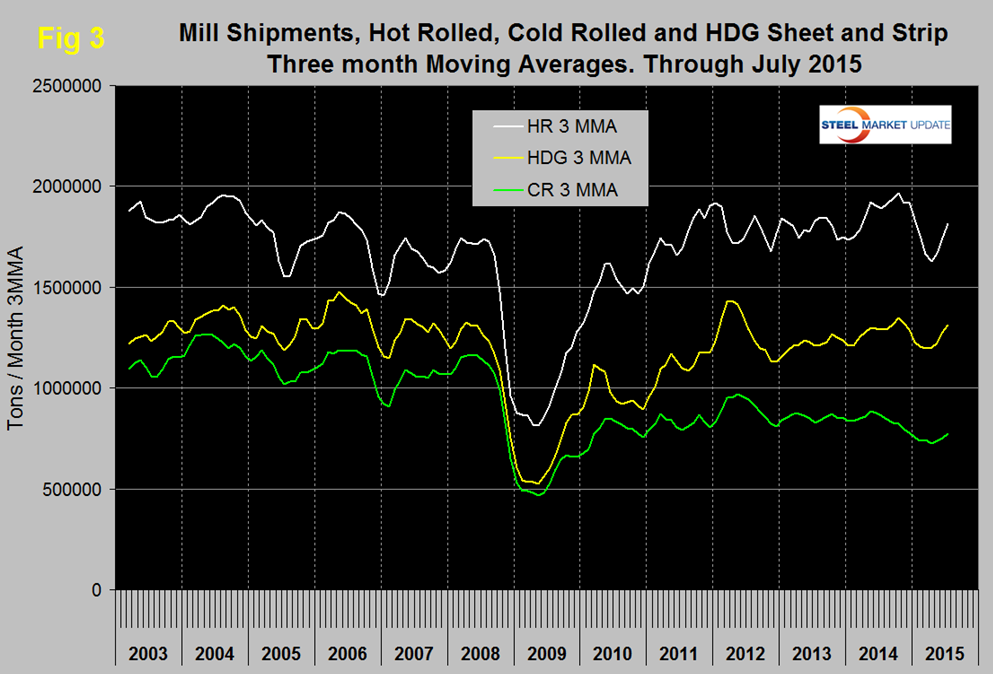
Three months through July year over year was down by 3.9 percent. These numbers exemplify why it’s necessary to look at different time periods to get the whole picture. Hot rolled and cold rolled followed the same pattern in all three time comparisons. HDG had a positive Y/Y growth in 3 months through July. Other metallic coated had positive growth in all three time comparisons and electro-galvanized contracted across the board. Figure 3 puts these results into the long term contextsince January 2008.
Construction is a major driver of steel demand in the US and sheet products are no exception. Last week the Manufacturers Alliance for Productivity and Innovation (MAPI) had encouraging things to say about both the residential and nonresidential markets. “Expect the construction supply chain to be a primary driver of manufacturing growth over the next two years”. Though they didn’t spell out steel specifically we believe their comments are directly relevant to our businesses.
The MAPI Foundation’s latest quarterly analysis expects a stronger housing market and healthy non-residential construction to spur growth in related industrial sectors. “You’ll some of the fastest growth in some of these industries,” MAPI Foundation Chief Economist Daniel Meckstroth said during a webcast this week. Meckstroth said that construction in the manufacturing sector, in particular, is “booming” at the moment after rising 56 percent in the first half of 2015.
The decline in natural gas prices in the U.S. helped spark substantial capital investment in chemical manufacturing and plastics production, both of which use natural gas as a feedstock.
Investment in equipment, meanwhile, was kept in check by a decline in energy drilling equipment and agricultural machinery – the result of low crude and crop prices, respectively.
Meckstroth reiterated that low crude prices ultimately help the U.S. while the continued strength of the dollar will impede the nation’s economic growth. Consumer spending, however, remains high due to continued job growth.
SMU Comment: Import market share is still very high, longs being even worse than sheet products. However imports are no longer in the driver’s seat when it comes to absorbing market share.


