

Market Data

September 21, 2015
Currency Update for Steel Trading Nations
Written by Peter Wright
As readers are well aware, the Fed announcement on the 17th was a nonevent as far as interest rates are concerned. This morning as we examined the currency values of the sixteen steel trading nations that we track, it was evident that traders anticipated this lack of action around the 10th to the 13th and began to act in correct anticipation. In other words, anticipation of a rate increase that had been priced in went away. The dollar began to weaken at that time against all of them except Japan.
![]()
We have two data sources for this report. These are the Federal Reserve and the Oanda forex trading platform. An explanation of these sources is given at the end of this report. Oanda is current every day but the Federal Reserve daily broad index (BI) is normally about eight days in arrears. As of September 21st, the Fed’s latest daily update was September 11th, and, therefore, was ten days behind the individual steel trading currency data that we are presenting here. The daily BI did show a weakening trend beginning on September 7th at 120.6132 and falling to 120.1577 on the 11th.
Figure 1 shows that the value of the US dollar as recorded by the daily BI.
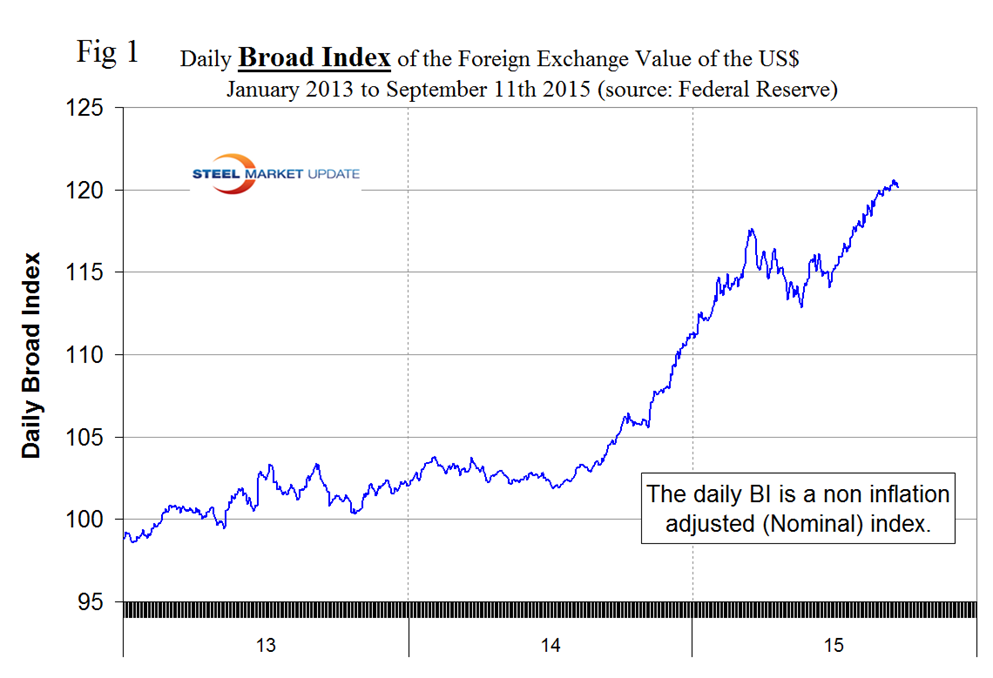
The small decline is visible at the end of the curve and we expect this will intensify for the subsequent few days when more data is released. The value on September 7th was the highest since April 29, 2003 as a flight to safety continues driven by fears and uncertainty about the global economy. Through September 11th, the BI has appreciated by 14.7 percent in 12 months and by 4.4 percent in 3 months. When (not if) the Fed raises rates it will drive the value of the dollar higher. Last month theFederal Reserve Bank of Atlanta President Dennis Lockhart made the following comments that we reported on August 29th and we are repeating because it is still pertinent. He said he continues to expect the first interest-rate hike in nearly a decade this year, while cautioning that a stronger dollar, a weaker Chinese yuan and falling oil prices complicate the outlook. “I expect the normalization of monetary policy —- that is, interest rates —- to begin sometime this year,” without citing a particular month. “Currently, developments such as the appreciation of the dollar, the devaluation of the Chinese currency, and the further decline of oil prices are complicating factors in predicting the pace of growth.” Lockhart declined to spell out if he favored moving in September or delaying liftoff. “I’m going to stick with later this year. We have three more meetings,” he told a Bloomberg reporter after delivering the speech.
On September 17th, following the Fed announcement, the Colorado Wealth management Fund published an article that we have paraphrased here; in it they published a chart (Figure 2) of Federal Reserve Board members thoughts on future rates.
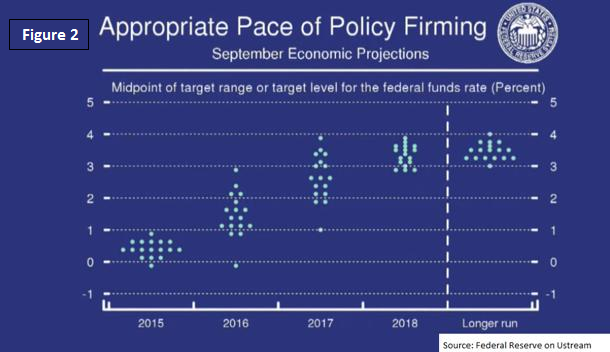
When they should be increased and by how much. The interesting thing here is that the range on 2016 and 2017 is fairly tall while 2018 and the longer run estimates have a fairly short range. For any investors struggling with that concept, it means members of the Federal Reserve have a substantial disagreement between those that are the most hawkish and those that are the most dovish. Some want to see rates increase substantially more than others. A diverse group of opinions encourages more discussion and careful analysis. Diverse opinions are helpful in preventing “group think”. This range should encourage lively discussion and careful analysis of the right path. During the Q&A time an analyst asked, “What if we never escape low interest rates?” Yellen scoffed into the microphone, perhaps unintentionally, before responding that it seemed like an extremely unlikely situation. I would agree, rates won’t stay low forever but I don’t believe they will be increasing rapidly. Negative Rates? “Let me be clear,” said Yellen, “negative rates were not something we seriously considered today.” It’s good to see that the Federal Reserve is not strongly considered such a movement. Negative rates in the most developed financial market in the world might require re-writing some of the economics textbooks.
It does not necessarily follow that the steel trading currencies follow the BI and, as we stated above, we don’t know how the BI moved in the last 10 days. Our examination of the 16 steel trading nations indicated that in the four days between the Fed announcement and September 21st some of them once again began to decline against the dollar. In the three months through the 21st, the dollar has strengthened against 14 of the 16 steel trading nations, against 8 in the last month and against 4 in the last 7 days.
Table 1 shows the number of currency units of steel trading nations that it takes to buy one US dollar and the change in one year, three months, one month and seven days. The table is color coded to indicate strengthening of the dollar in red and weakening in green. We regard strengthening of the US Dollar as negative and weakening as positive because the effect on net imports.
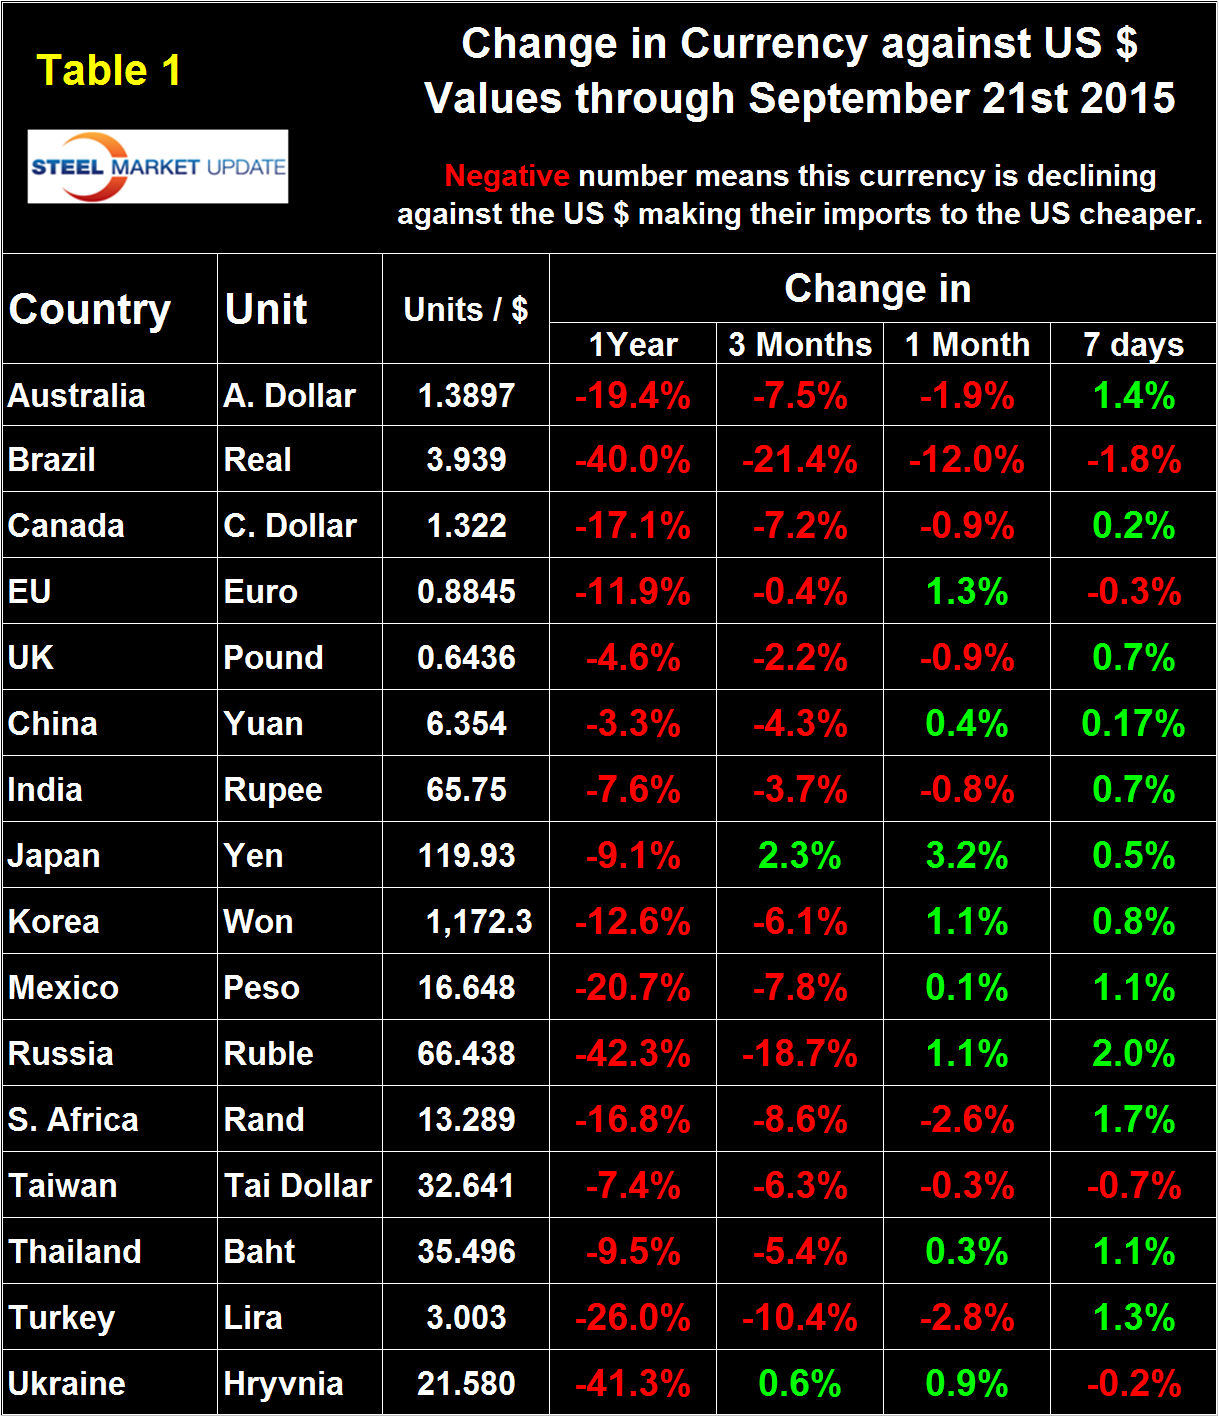
In 2014, 25 percent of the U.S. economy was related to international trade, therefore, currency swings can have a huge effects on the economy in general and of the steel industry in particular. At the 12 month level the dollar has strengthened against every one of the steel trading currencies.
In each of these reports we comment on a few of the 16 steel trading currencies but charts for each are available through August 21th for any reader who requests them. This month we will highlight the three main commodity countries that we are interested in, Canada, Australia and Brazil followed by Turkey, Russia and Ukraine.
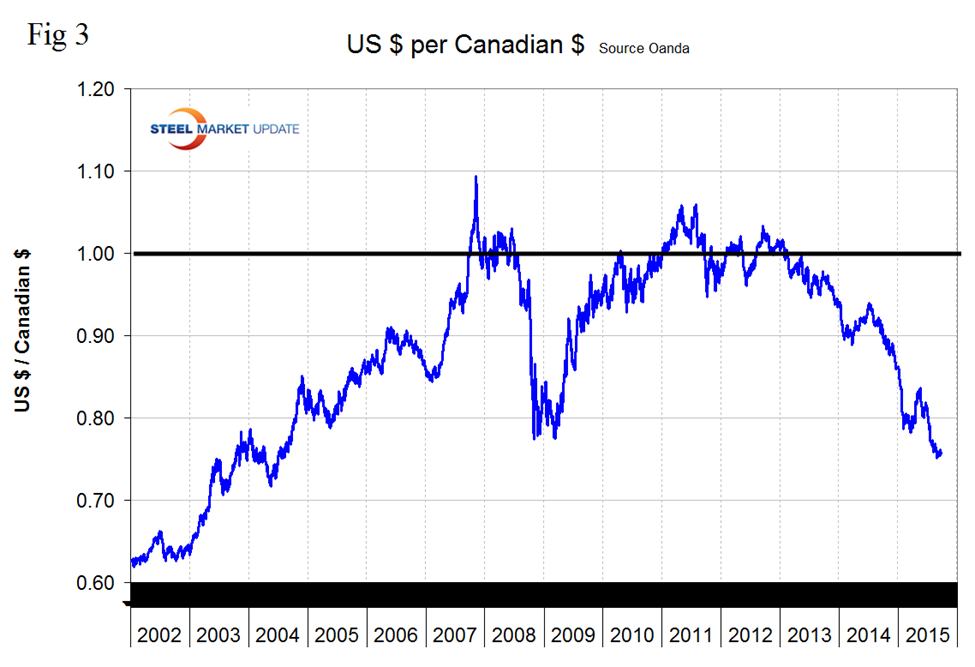
Canada. The Canadian dollar has declined by 17.1 percent in 12 months and by 7.2 percent in 3 months (Figure 3). Lower now than it was after the recession and in the lowest range for over 11 years.
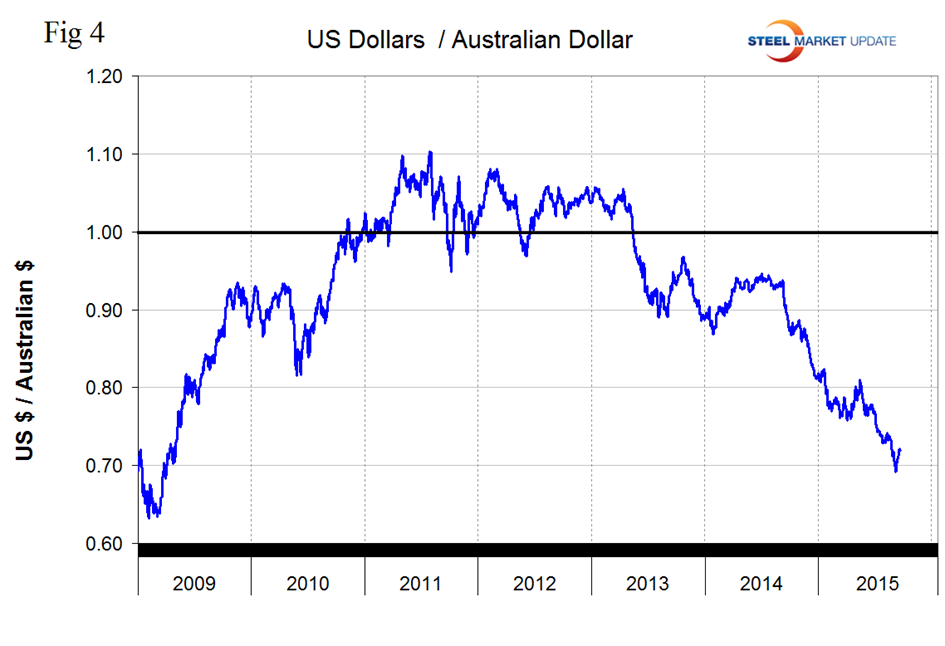
Australia. The Australian dollar has declined by 19.4 percent in 12 months and by 7.5 percent in 3 months (Figure 4). In the lowest range since Q2 2009.
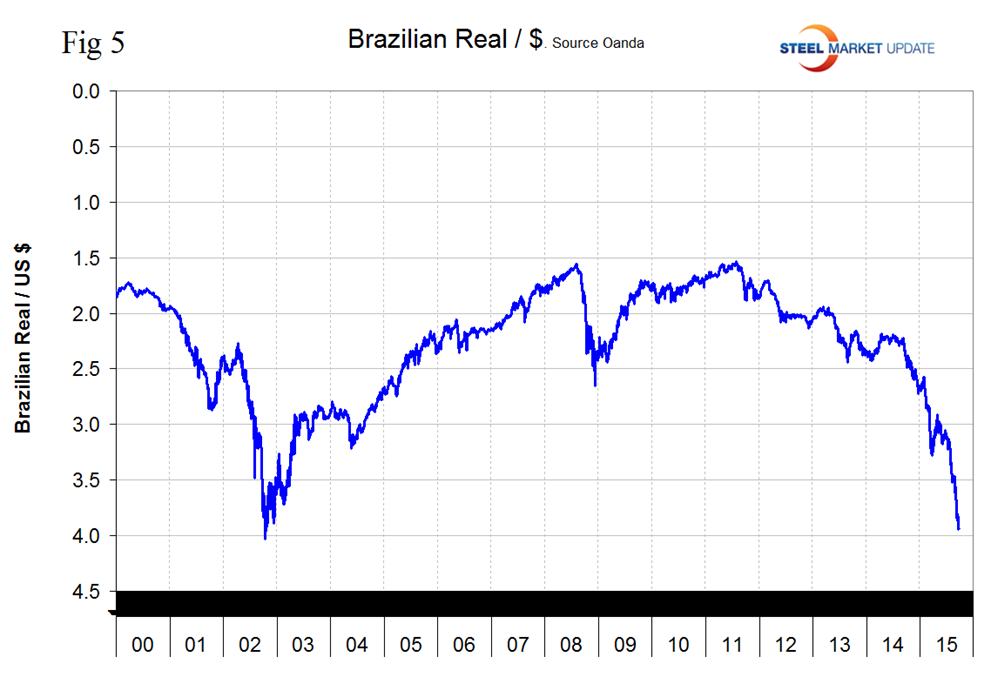
Brazil. The Brazilian Real dollar has declined by 40.0 percent in 12 months and by 21.4 percent in 3 months (Figure 5). In the lowest range since late 2002.
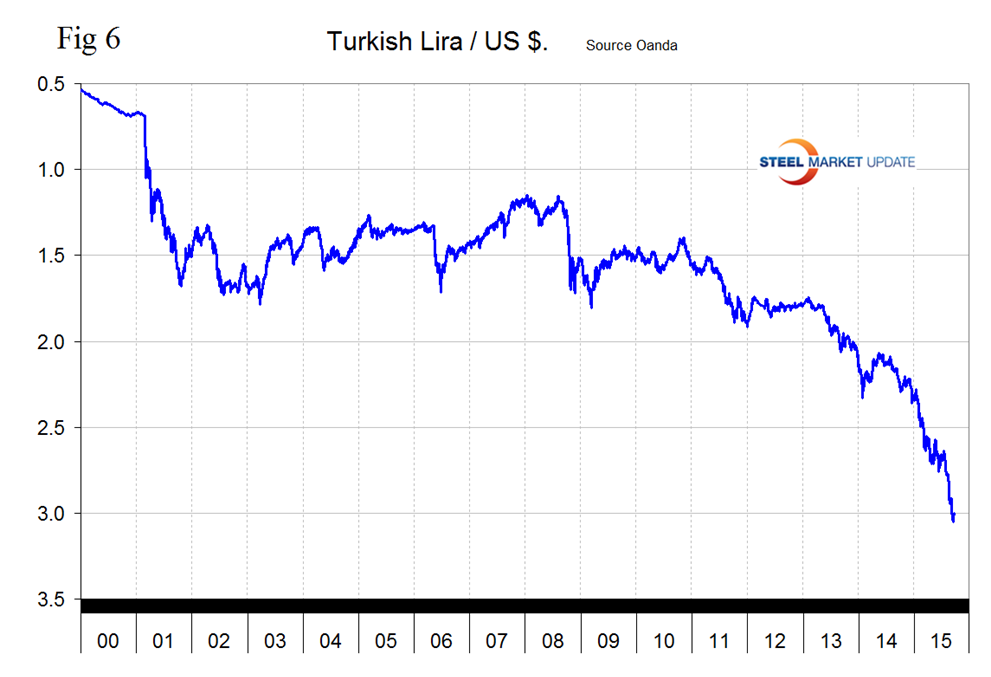
Turkey. The Turkish Lira has declined by 26.0 percent in 12 months and by 10.4 percent in 3 months (Figure 6). In the lowest range ever.
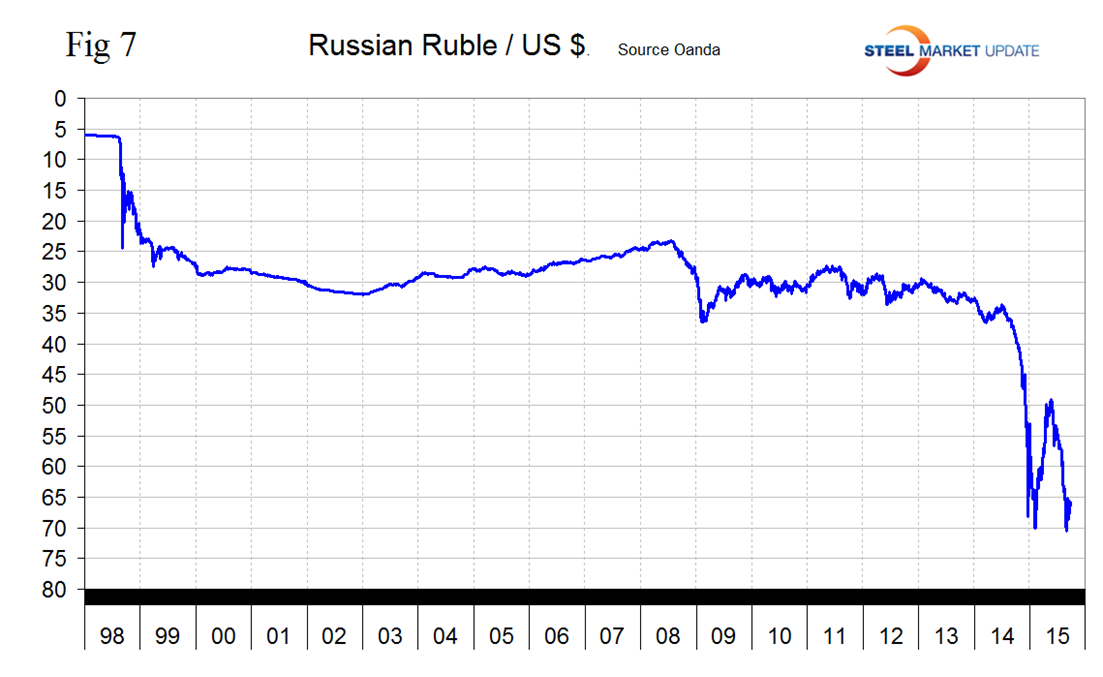
Russia. The Russian Ruble has declined by 42.3 percent in 12 months and by 18.7 percent in 3 months (Figure 7). Had a recent low of 70.6 on August 25th and has since recovered to 66.4 to the US $.
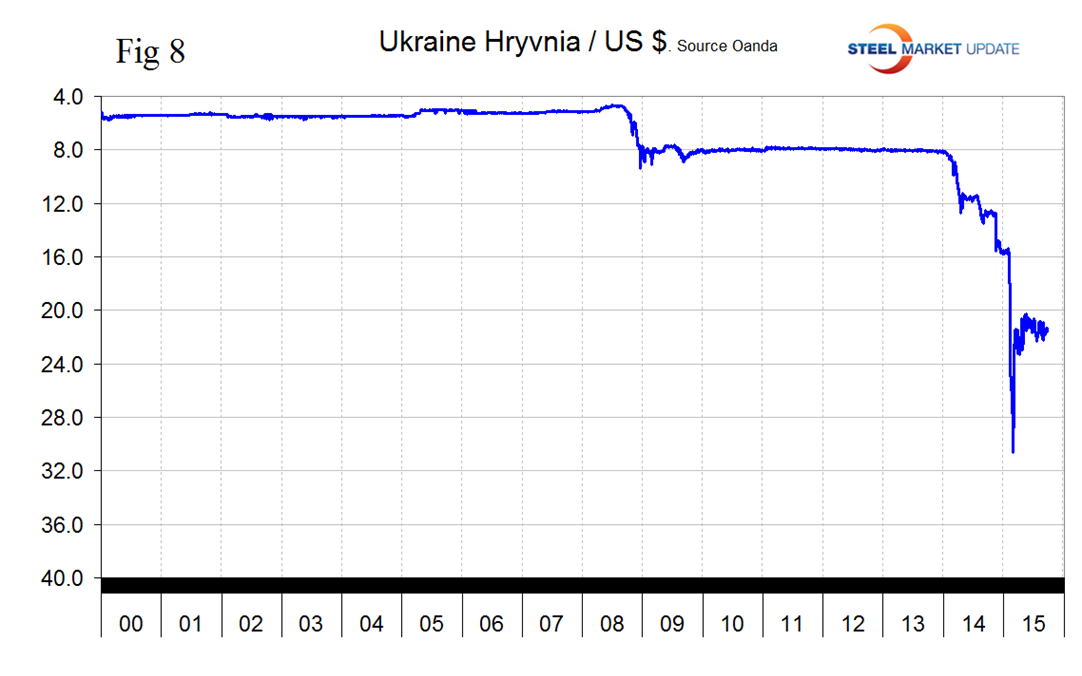
Ukraine. The Ukrainian Hryvnia has declined by 41.3 percent in 12 months and by 0.6 percent in 3 months (Figure 8). The 3 months number is not a typo though we took a double take! The Hryvnia has stabilized.
Explanation of Data Sources: The broad index is published by the Federal Reserve on both a daily and monthly basis. It is a weighted average of the foreign exchange values of the U.S. dollar against the currencies of a large group of major U.S. trading partners. The index weights, which change over time, are derived from U.S. export shares and from U.S. and foreign import shares. The data are noon buying rates in New York for cable transfers payable in the listed currencies. At SMU we use the historical exchange rates published in the Oanda Forex trading platform to track the currency value of the US $ against that of sixteen steel trading nations. Oanda operates within the guidelines of six major regulatory authorities around the world and provides access to over 70 currency pairs. Approximately $4 trillion US $ are traded every day on foreign exchange markets.


