Analysis

September 23, 2015
July Heating and Cooling Equipment Shipment Data
Written by Brett Linton
Below is the latest release issued by the the Air-Conditioning, Heating, and Refrigeration Institute (AHRI) regarding residential and commercial heating and cooling equipment shipments through July 2015. You may read the press release on their website here.
Residential Storage Water Heaters
U.S. shipments of residential gas storage water heaters for July 2015 increased 3.5 percent, to 329,896 units, up from 318,733 units shipped in July 2014. Residential electric storage water heater shipments decreased 15.1 percent in July 2015 to 266,777 units, down from 314,283 units shipped in July 2014.
For the year-to-date, U.S. shipments of residential gas storage water heaters increased 7.4 percent, to 2,783,727, compared to 2,591,340 units shipped during the same period in 2014. Residential electric storage water heater shipments increased 4.2 percent year-to-date, to 2,579,986 units, compared to 2,474,912 units shipped during the same period in 2014.
Commercial Storage Water Heaters
Commercial gas storage water heater shipments increased 0.2 percent in July 2015 to 7,143 units, up from 7,128 units shipped in July 2014. Commercial electric storage water heater shipments increased 14.3 percent in July 2015 to 6,999 units, up from 6,122 units shipped in July 2014.
Year-to-date U.S. shipments of commercial gas storage water heaters increased 5.7 percent, to 60,071 units, compared with 56,841 units shipped during the same period in 2014. Year-to-date commercial electric storage water heater shipments increased 13.3 percent to 49,732 units, up from 43,901 units shipped during the same period in 2014.
Warm Air Furnaces
U.S. shipments of gas warm air furnaces for July 2015 increased 13.1 percent to 221,563 units, up from 195,905 units shipped in July 2014. Oil warm air furnace shipments decreased 0.3 percent to 1,899 units in July 2015, down from 1,905 units shipped in July 2014.
Year-to-date U.S. shipments of gas warm air furnaces increased 1.2 percent to 1,442,979 units, compared with 1,426,426 units shipped during the same period in 2014. Year-to-date U.S. shipments of oil warm air furnaces increased 12.4 percent to 16,007, compared with 14,237 units shipped during the same period in 2014.
Central Air Conditioners and Air-Source Heat Pumps
U.S. shipments of central air conditioners and air-source heat pumps totaled 726,607 units in July 2015, up 2.3 percent from 710,279 units shipped in July 2014. U.S. shipments of air conditioners increased 4.8 percent to 506,914 units, up from 483,850 units shipped in July 2014. U.S. shipments of air-source heat pumps decreased 3.0 percent to 219,693 units, down from 226,429 units shipped in July 2014.
Year-to-date combined shipments of central air conditioners and air-source heat pumps increased 2.3 percent, to 4,647,076 units, up from 4,541,415 units shipped in July 2014. Year-to-date shipments of central air conditioners increased 2.6 percent to 3,095,315 units, up from 3,016,398 units shipped during the same period in 2014. The year-to-date total for heat pump shipments increased 1.8 percent to 1,551,761 units, up from 1,525,017 units shipped during the same period in 2014.
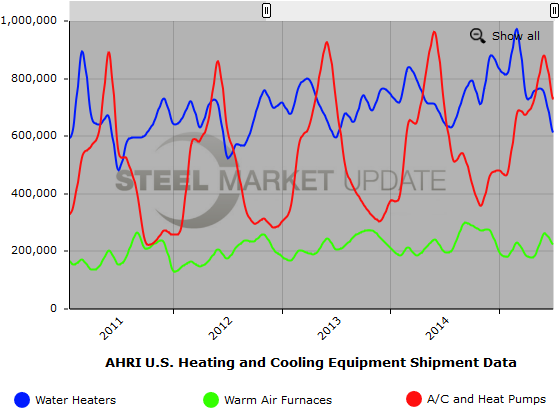
Below is a graph showing the history of water heater, warm air furnace, and air conditioner shipments. You will need to view the graph on our website to use it’s interactive features, you can do so by clicking here. If you need assistance with either logging in or navigating the website, please contact our office at 800-432-3475 or info@SteelMarketUpdate.com.