Market Data

October 16, 2015
Service Centers Can’t Control Demand (or Themselves) as Apparent Excess Rises
Written by John Packard
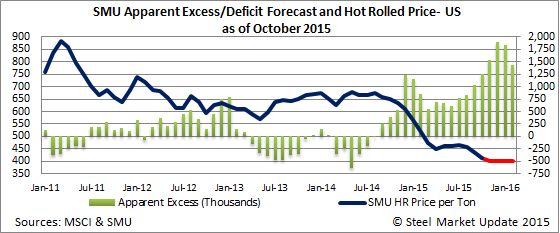
The Metal Service Center Institute (MSCI) released September shipments and inventories for U.S. distributors. We reported in Thursday evening’s issue that flat rolled steel shipments were weaker than expected while receipts were higher than expected. The combination of the two has driven our Apparent Excess to over 1 million net tons.
The SMU Flat Rolled Service Center Apparent Excess/Deficit model is based on the number of days supply distributors need to have for their inventories to be in balance. Based on our model service centers are carrying 1,038,000 tons more than what is needed to be in balance.
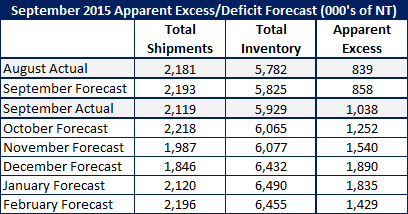
Looking at the September numbers in more detail: Our forecast was for shipments to be 6.5 percent below last year levels. This took our forecast for shipments to be 2,193,000 tons and in actuality they came in 9.7 percent below year ago levels at 2,119,000 tons.
When looking at inventories our September forecast was based on the 3 year average for receipts for the month and then we reduced the tonnage by 5 percent. Our forecast called for daily receipts of 106,512 tons per day and in reality receipts came in at 107,938 tons.
New Forecast
Our new forecast is based on shipments being 8 percent lower than year ago levels for the months of October, November and December and 3 percent below for the months of January and February. We can’t ignore the trend which over the past six months shipments averaged 8.85 percent lower than the prior year. January and February tend to be better business months so we tried to be more optimistic by reducing the negatives to only 3 percent.
Receipts seem to be the area where the service centers are unable to control themselves. After looking at the license data through October 15th and speaking to a number of traders at METALCON on Wednesday we have become less convinced that the service centers are controlling their desire to buy. We raised our daily receipts for October, November and December from where we projected last month. Our new forecast calls for receipts to remain elevated in October at the same levels as September (107,000 tons per day). We have increased our receipt forecast to 100,000 tons per day during November and December and then we are going with a 5 percent reduction in receipts over the 3 year average for January and February.
Hot Rolled Prices to Remain Flat to Lower
With the excessive inventories we do not see any ability of the domestic steel mills to increase prices without shutting down excessive supply (which is in the works as US Steel has WARN notices out to their Granite City Works and AK Steel just put out WARN notices to Ashland). Without shutdowns we believe prices will remain stuck around $400 per ton for benchmark hot rolled.