Market Data

November 1, 2015
October at a Glance
Written by John Packard
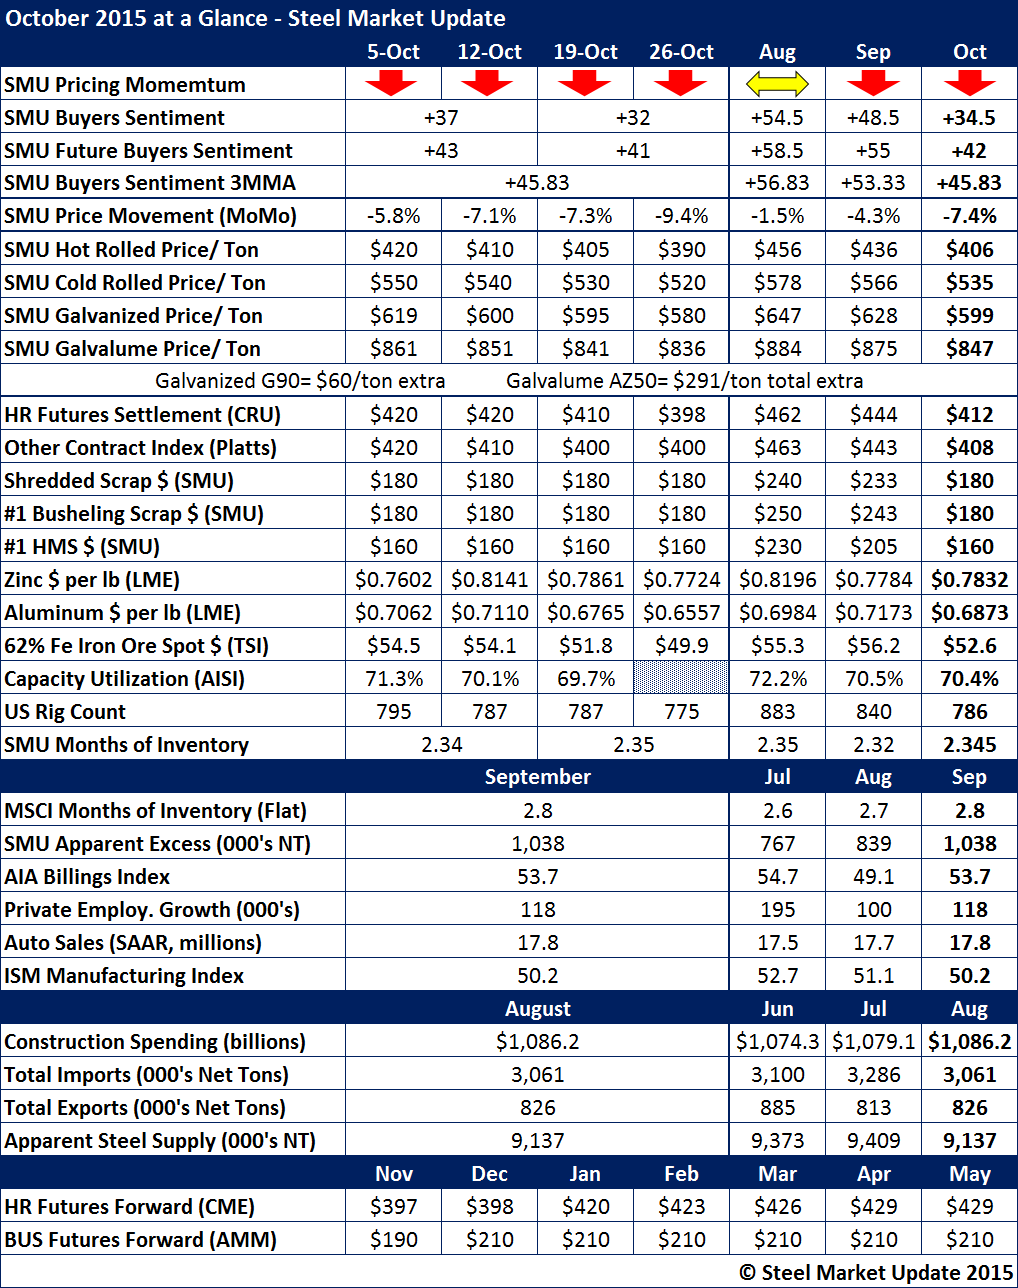
October was the second month in a row where SMU had our Pricing Momentum Indicator pointing toward lower pricing. SMU reports hot rolled coil, cold rolled, galvanized and Galvalume pricing every Tuesday evening. During October we produced our steel prices indices four times. HRC was reported at $420 per ton the first Tuesday of the month and by the last Tuesday had slipped $30 per ton to $390 per ton.
Other flat rolled products saw their prices slip in similar fashion to hot rolled coil.
Our HRC average for the month was $406 per ton. The CRU average was $412 per ton and Platts averaged $410 per ton during the same time period.
Scrap prices, a key indicator for steel, dropped significantly during the month of October as can be seen in the table below.
Zinc and aluminum prices seemed to stabilize during the month while iron ore slip modestly dropping below $50 per dry metric ton by late in the last week of the month.
The steel mills capacity utilization rates continue to suffer and are well below the 80 percent target used by the mills to suggest a healthy steel market.
The biggest problem appears to be inventory levels at the domestic steel service centers as the MSCI reports flat rolled inventories to be at 2.8 months supply. Steel Market Update has service centers holding an excess of 1,038,000 tons of flat rolled inventories on their floors based on our proprietary model.