

Market Data

November 6, 2015
Currency Update for Steel Trading Nations
Written by Peter Wright
We have two data sources for this report. These are the Federal Reserve and the Oanda forex trading platform. An explanation of these sources is given at the end of this report. Oanda is current every day but the Federal Reserve daily broad index (BI) is normally about eight days in arrears. As of November 5th the Fed’s latest daily update was October 30th, therefore was six days behind the individual steel trading currency data that we are presenting here.
![]()
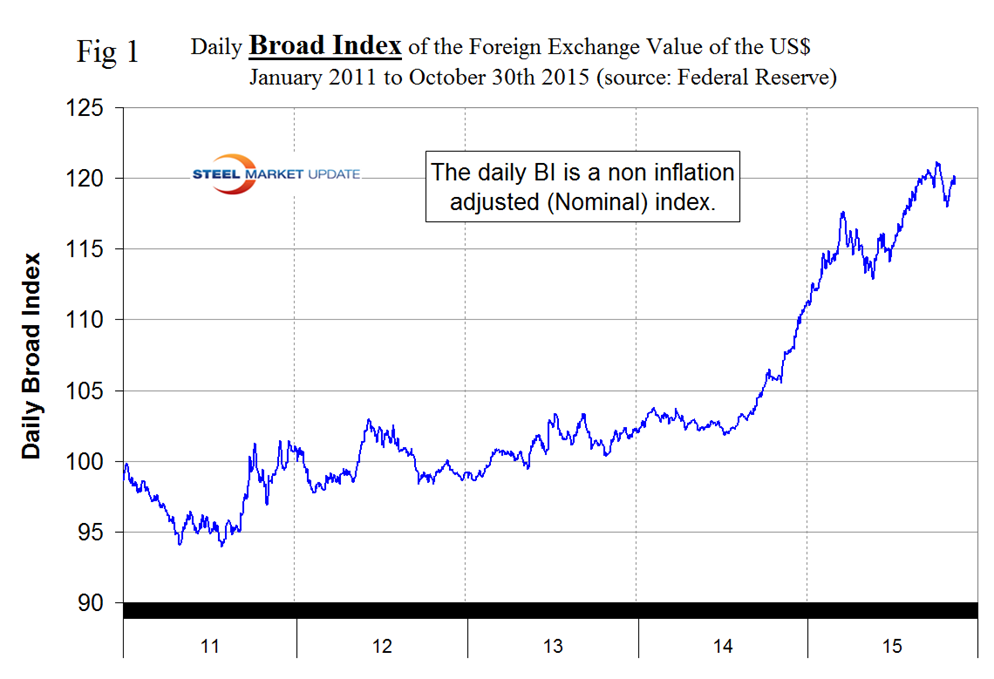
Our last currency update was October 15th and at that time the dollar was still weakening in response to the Fed’s decision on September 17th not to raise interest rates. The value on September 7th was the highest since April 29th 2003 driven both by anticipation of a Fed rate increase and by a flight to the safety of the dollar as uncertainty about the global economy continued. In a rolling 7 day basis the dollar weakened from September 30th through October 16th. Since then the through October 30th the dollar reversed course and began to strengthen again (Figure 1).
When (not if) the Fed raises rates it will drive the value of the dollar higher. Figure 2 shows schematically when the 17 individual members of the board of the Federal Reserve expect interest rates to increase and by how much.
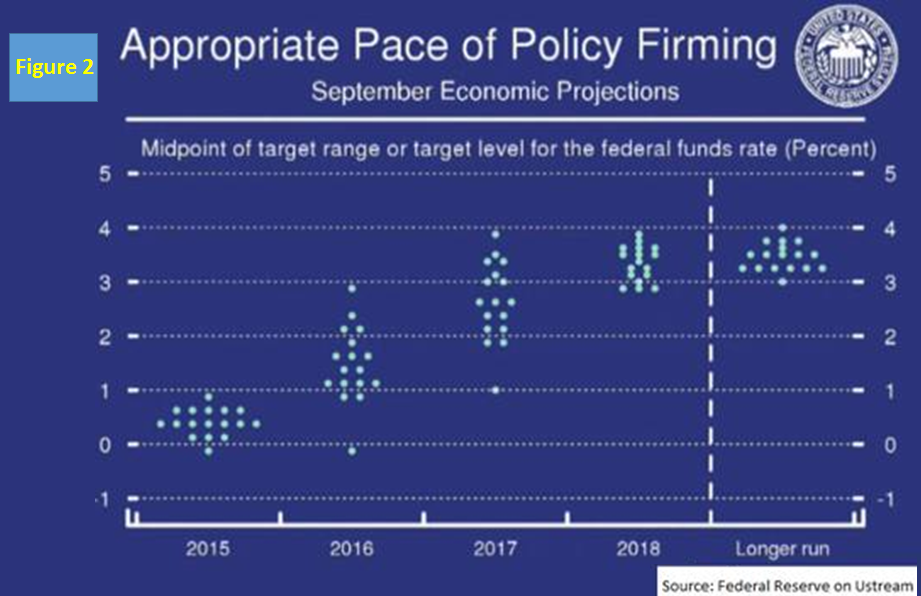
There is a wide spread between zero and 3 percent for next year but the members thoughts are much more closely aligned for 2018.
On October 31st Fox Business News reported as follows: The strong U.S. dollar is once again emerging as a major theme this earnings season as large multi-national companies have seen their profits eroded overseas. “I don’t think it’s going away anytime soon,” said Cliff Waldman, senior economist for the Manufacturers Alliance for Productivity and Innovation (MAPI), a public policy and economics research organization in Arlington, Virginia. According to a study by FactSet, 70 percent of the companies had cited the strong dollar as a negative impact on their 1Q earnings of 2015. The problem for these big multinationals occurs when their profits generated in weakened currencies such as the Euro or the Brazilian real are brought back to the U.S. and exchanged for the stronger U.S. dollar. The strong U.S. dollar also makes it more expensive to sell U.S. exports overseas, which benefits the international competitors of U.S. companies. Waldman explained that the value of the U.S. dollar has risen because nearly every other major global currency is being intentionally devalued by international central banks to ward off deflation. With all those currencies losing value, the only safe bet for currency investors is the U.S. dollar. “Investors are betting on the dollar because it’s the safest bet and that’s pushed it higher,” he said. “The world never found its balance after the financial crisis,” said Waldman. “Countries around the world are fighting deflation any way they can. They are devaluing their currencies to stimulate exports and as a way of lifting their economies out of weakness.” The European Central Bank is “doing everything they can to keep the currency as low as possible,” he added, because “no one wants the Eurozone to fall into deflation.” Waldman said “U.S. companies will be facing the strong dollar for the foreseeable future because the problems that are causing the weakened currencies overseas are structural not cyclical. It’s not something that’s going to be fixed in a few quarters.”
It does not necessarily follow that the steel trading currencies follow the BI and today that is the case. In one month through October 15th the dollar weakened against 13 of 16, in one month through November 5th it weakened against 11 of 16.
Table 1 shows the number of currency units of steel trading nations that it takes to buy one US dollar and the change in one year, three months, one month and seven days.
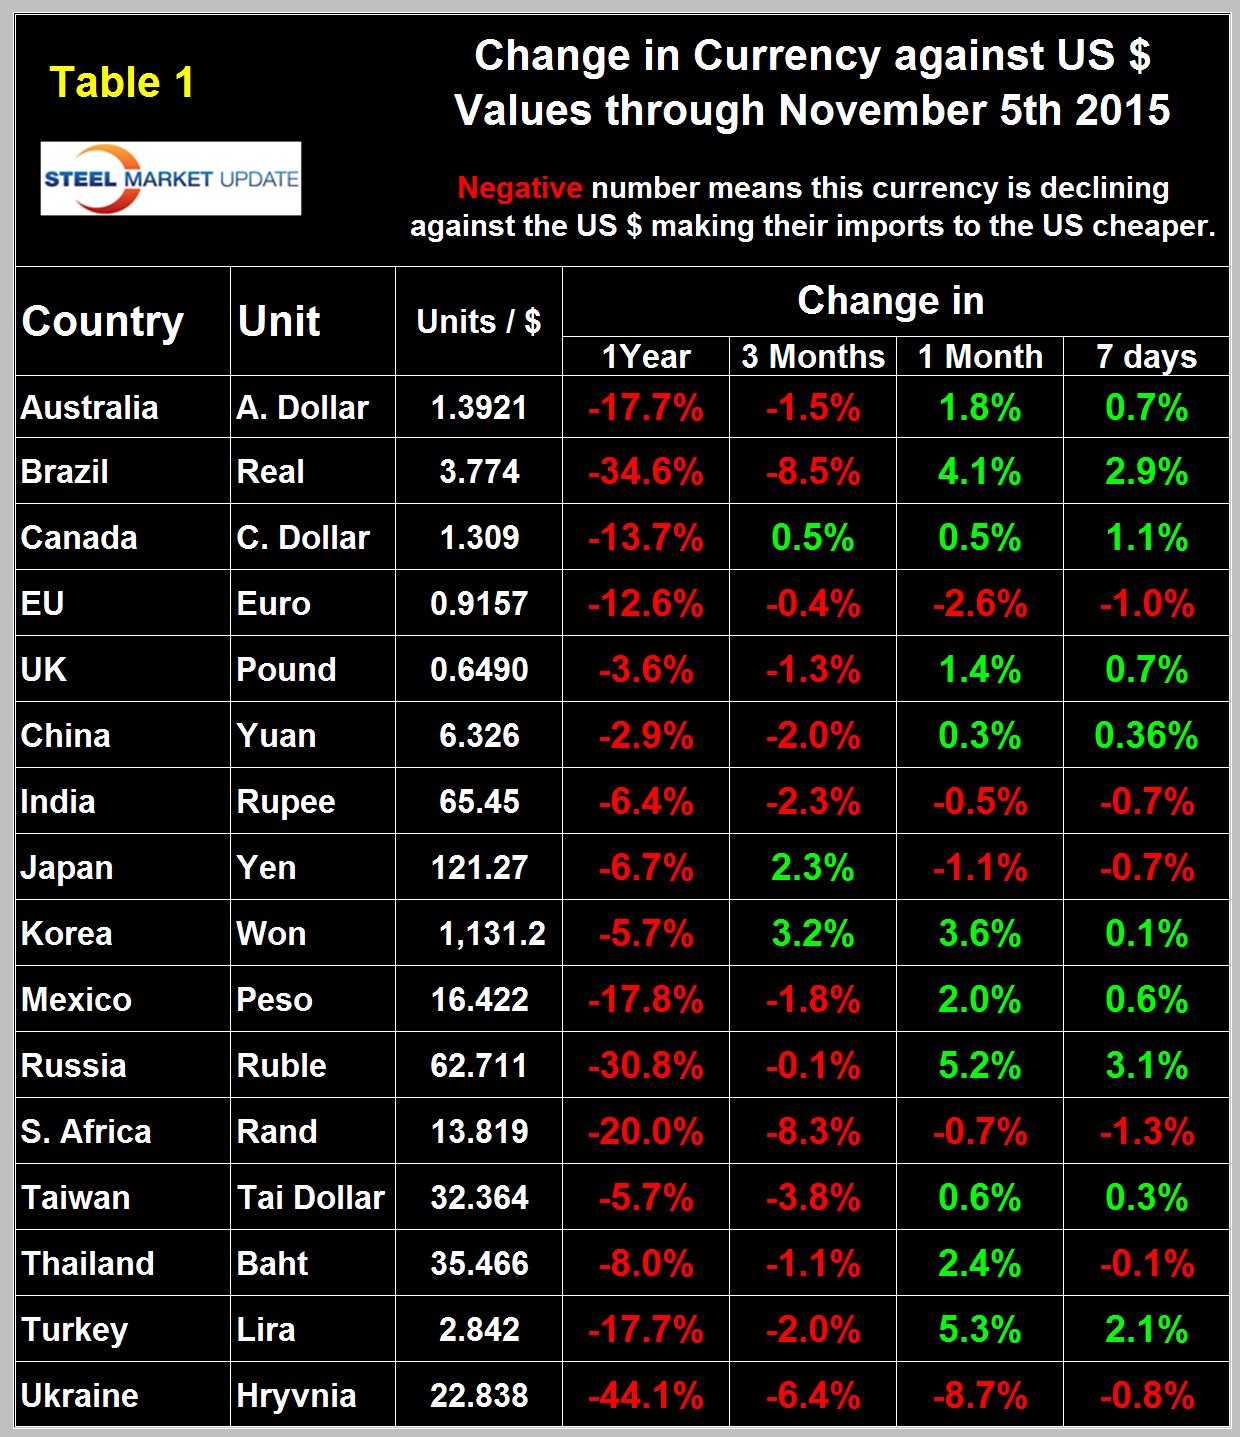
The table is color coded to indicate strengthening of the dollar in red and weakening in green. We regard strengthening of the US Dollar as negative and weakening as positive because the effect on net imports. In 2014, 25 percent of the U.S. economy was related to international trade therefore currency swings can have a huge effects on the economy in general and of the steel industry in particular. At the 12 month level the dollar has strengthened against every one of the steel trading currencies.
In each of these reports we comment on a few of the 16 steel trading currencies listed in Table 1 but charts for each are available through November 5th for any reader who requests them.
The Euro: On November 5th it took 1.0921 US dollars to buy one Euro (Figure 3).
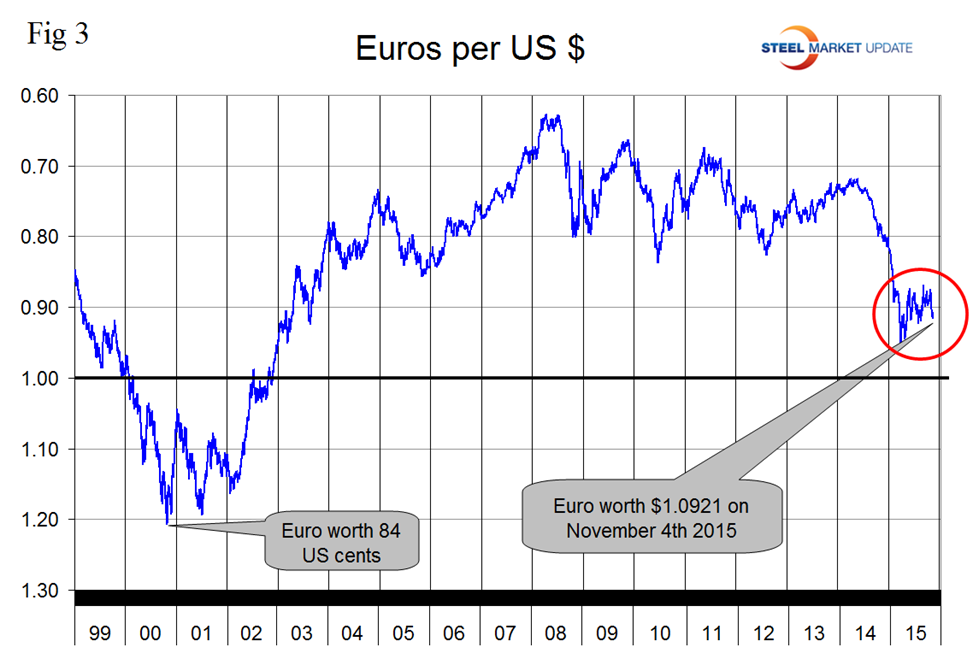
Through that date the Euro had weakened by 12.6 percent in one year and by 2.6 percent in the last month. On November 3rd Invesco PowerShares reported as follows; the euro continued its slide against the US dollar after European Central Bank (ECB) President Mario Draghi hinted that the ECB’s program of quantitative easing would likely continue through the year and possibly expand in December. Draghi stated that the ECB is “willing and able to act by using all the instruments available within its mandate,” and added that those instruments could include lowering overnight deposit rates. The news pushed the euro down to $1.1108 – its lowest level since Aug. 19. The ECB’s accommodative tone also prompted the German two-year note yield to plummet 30 basis points to -0.3 percent. What does this news mean for US investors with exposure to Europe?
– Against a backdrop of negative interest rates, equities are one of the only ways to generate return on capital in Europe. (After all, investing in short-term paper raises the specter of negative returns.) Dividend-paying stocks are a particularly compelling option.
– The ECB’s lack of confidence in economic growth is an indicator of economic risk, and highlights the need for downside equity protection. Stocks are driven by earnings, and earnings growth currently appears uncertain – particularly given the ECB’s statements. Low volatility strategies can be an attractive option in this type of environment. Of course, low volatility cannot be guaranteed.
– Negative yields at the short end of the yield curve in Germany present additional risk to the USD/EUR exchange rate. Given these negative rates, capital flows are more likely to stay clear of Europe, putting further pressure on the value of the euro. Already, the spread between the US two-year Treasury note and the German two-year note is 93 basis points – its widest level since the mid-2000s.
The Japanese Yen has weakened by 6.7 percent in one year and by 1.1 percent in one month (Figure 4).
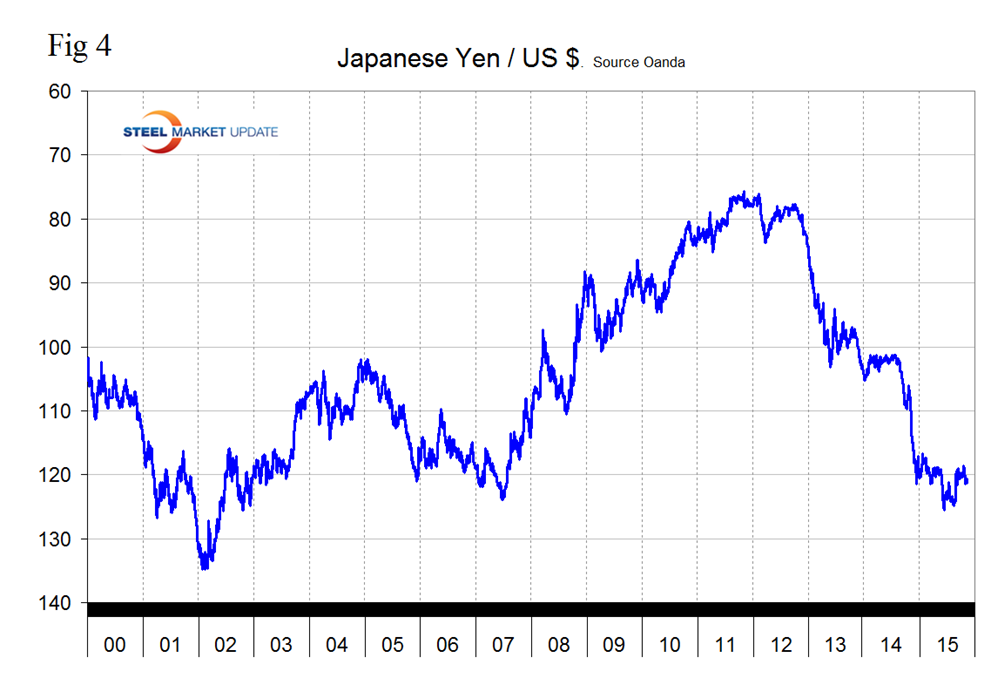
On November 5th it took 121.27 Yen to buy one dollar. Invesco PowerShares commented on Nov 3rd, Japan is experiencing similar outcomes to the Euro for slightly different reasons. The Japanese economy shows signs of softening and it appears the trade sector is feeling the pain of slower global growth. Japanese exports increased only 0.6 percent on a year-over-year basis in September, and have decelerated of late. This weaker export profile may lift the USD/JPY exchange rate further, while presenting profit risk to Japanese firms. Monetary policy in Japan is unlikely to change in the short term and could be a headwind to higher interest rates. In addition, Bank of Japan (BOJ) Governor Haruhiko Kuroda went on record in mid-October stating that the BOJ would continue quantitative easing until inflation stabilizes at 2 percent. Underscoring potential risks, the Citigroup Economic Surprise Index has declined from over 100 in July to a recent reading of 8.8, indicating a loss of economic momentum relative to expectations. The Japanese two-year year bond is hovering around 0.01 percent and offering little return. Low rates in Japan provide little reason to hold the yen.
The Chinese Yuan: Following the devaluation in August the Yuan bottomed out at 6.4028 on August 27th. Since then the Yuan has recovered slightly to 6.3258 on November 5th. In the last year the Yuan is down by 2.9 percent but has recovered by 0.3 percent in the last month (Figure 5).
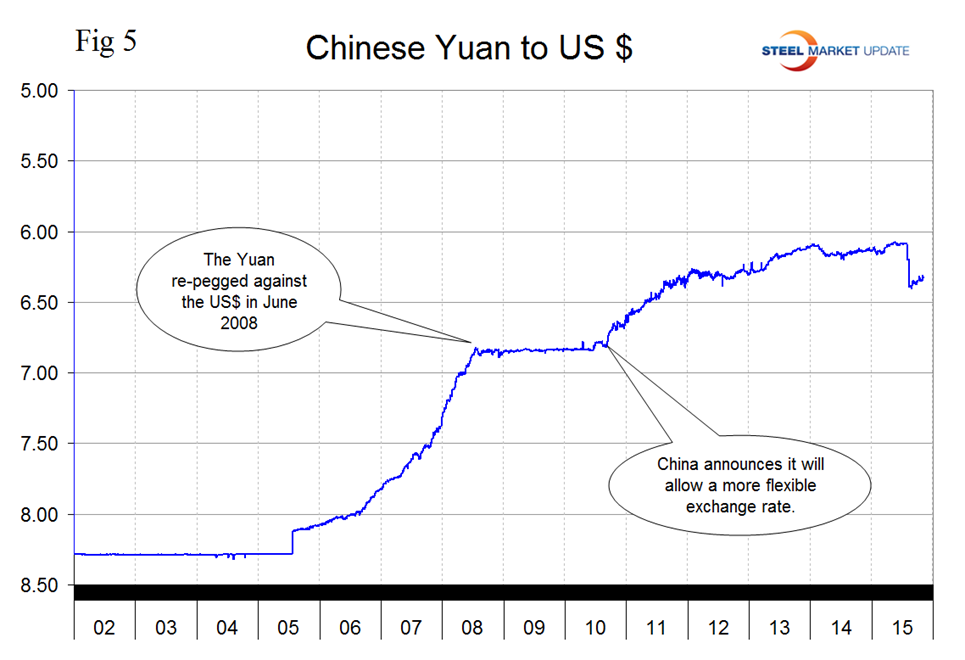
China is anxious for the Yuan to become part of the Special Drawing Rights system which is intended to supplement IMF member countries’ reserves. Currently the value of SDRs is based on four key currencies – the U.S. dollar, the euro, the Japanese yen, and the British pound. The inclusion of the Yuan could be implemented before the end of this year but there’s a possibility of the vote being put off until early next year. Apparently the United States is against its inclusion but Uncle Sam only has a voting share of 16.7 percent, so it can’t block China’s entry. Also it’s unlikely that the Americans want to repeat the embarrassment of their opposition to the China-led Asian Infrastructure Investment Bank (AIIB). Despite its opposition, most U.S. allies joined the AIIB anyway. For the Chinese government, getting the Yuan into the IMF’s exclusive currency club will be welcome news, given the capital outflows out of its currency this year. In fact, Standard Chartered estimates that IMF inclusion could trigger $1 trillion of inflows into the Yuan, as central banks add the currency to their reserves.
Explanation of Data Sources: The broad index is published by the Federal Reserve on both a daily and monthly basis. It is a weighted average of the foreign exchange values of the U.S. dollar against the currencies of a large group of major U.S. trading partners. The index weights, which change over time, are derived from U.S. export shares and from U.S. and foreign import shares. The data are noon buying rates in New York for cable transfers payable in the listed currencies. At SMU we use the historical exchange rates published in the Oanda Forex trading platform to track the currency value of the US $ against that of sixteen steel trading nations. Oanda operates within the guidelines of six major regulatory authorities around the world and provides access to over 70 currency pairs. Approximately $4 trillion US $ are traded every day on foreign exchange markets.


