

Prices

November 13, 2015
Premium View of Net Sheet Imports Thru September
Written by Peter Wright
The following article is one produced for our Premium level members as we look to delve deeper into the overall steel industry picture in the United States. You can learn more about becoming a Premium member either online or by contacting our office: info@SteelMarketUpdate.com
Net imports equals imports minus exports. We regard this as an important look at the overall trade picture and its effect on demand at the mill level.
![]() Figure 1 shows that net sheet product imports on a three month moving average (3MMA) basis at 679,880 tons in September continue to be more than double that which existed before the recession but have been declining all this year.
Figure 1 shows that net sheet product imports on a three month moving average (3MMA) basis at 679,880 tons in September continue to be more than double that which existed before the recession but have been declining all this year.
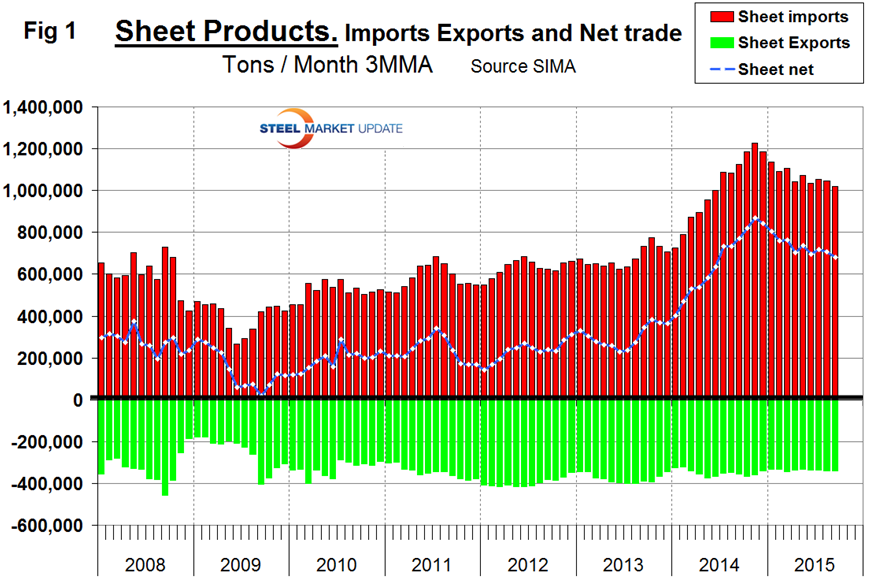
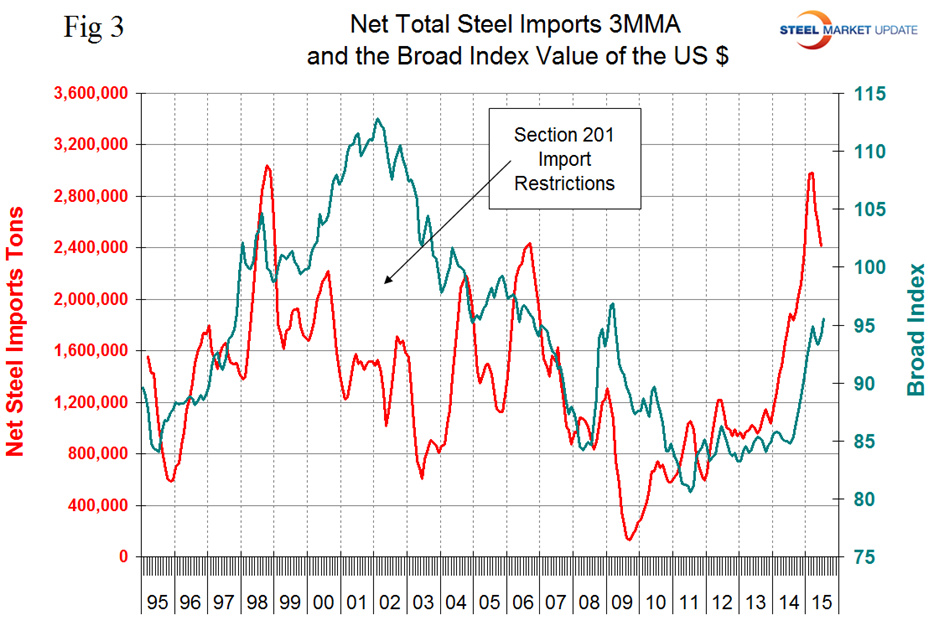
Compared to imports, exports have been relatively consistent for almost eight years. Table 1 shows net imports by product.
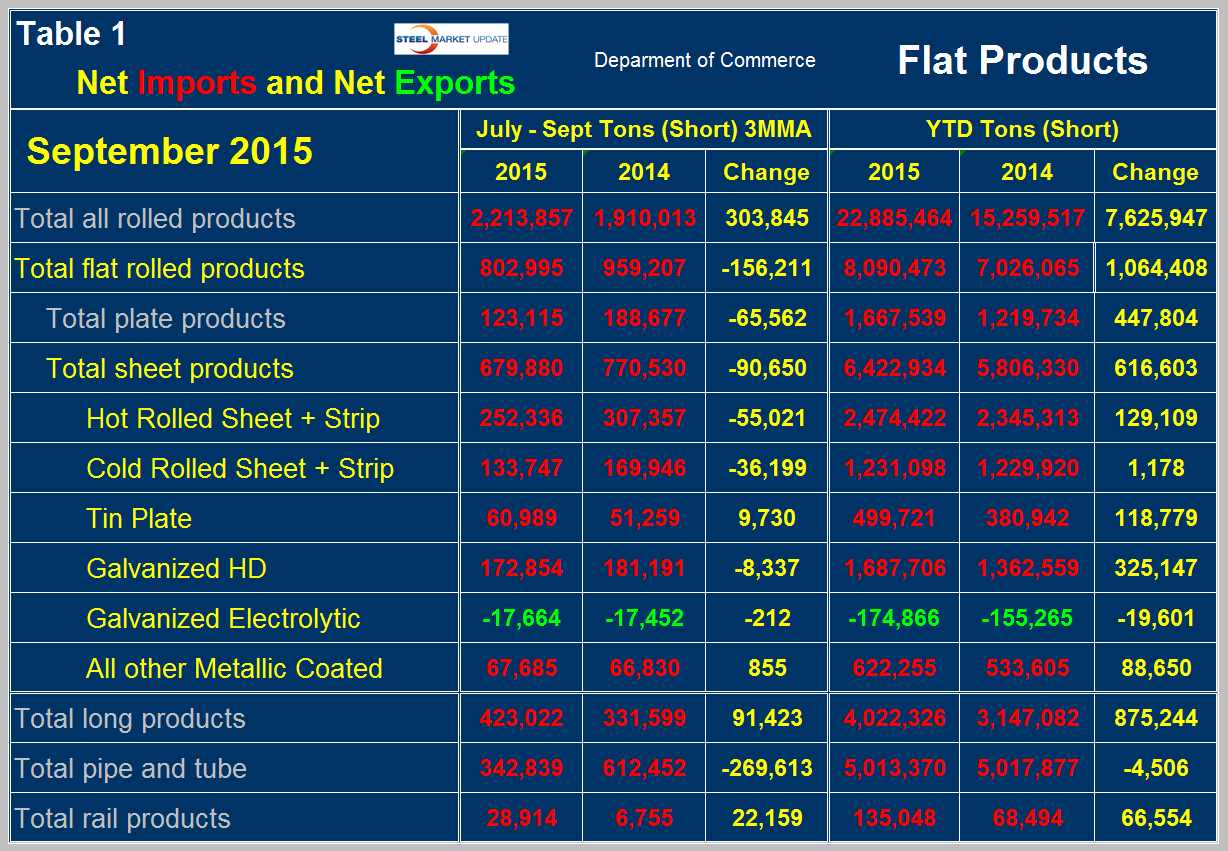
Year to date through September, total net flat rolled imports were 8,090,473 tons, up by 1,064,408 tons year over year. Of this total, 6,422,934 tons were sheet products, up by 616,603 tons. On a 3MMA basis, July through September, net sheet imports decreased by 90,650 tons per month year over year. The 3MMA of net imports decreased y/y on all sheet steel products except tin plate and cold rolled. Electro-galvanized is the only sheet product that currently enjoys net exports and in the latest data that surplus improved year over year. In Table 1 negative net imports (which means a trade surplus) are shown in green. Figure 2 shows the trend of monthly net sheet product imports since January 2011 on a 3MMA basis.
Net hot rolled imports declined sharply in January through April but reversed course in May through August before declining again in September. Hot dipped galvanized has had a tendency to move in the opposite direction to hot rolled this year. Cold rolled net imports declined every month from November last year through August, then increased slightly in September.
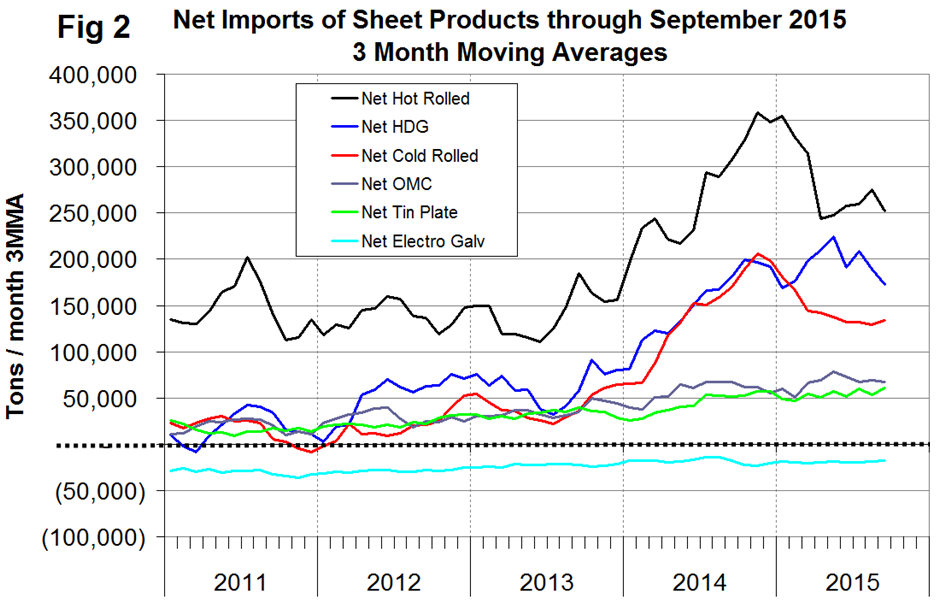
We believe there are two main drivers of the strength of net steel imports. The trade weighted value of the US $ is increasing which makes our exports less attractive to foreign buyers. It makes the US domestic market more attractive to foreign sellers because they reap more in their own currencies and it makes imports more attractive to domestic buyers. Figure 3 shows the relationship between net imports and the value of the $ since January 2011.
The divergence in the early 2000s was a result of “Section 201” import controls, over stocked service centers and a strong decline in US demand. The strengthening of the dollar is expected to continue in the immediate future and to accelerate when the Fed eventually begins to move on interest rates. The second reason is that steel demand in the US is relatively strong at the same time as global demand growth has softened. This is exactly what happened in the late 1990s after the Far Eastern currency crash which was followed by a collapse of the Ruble and a decline in the value of the Euro to 84 US cents. In the third quarter of 2015, global steel production contracted by 3.7 percent year over year and that trend is accelerating. Global steel capacity continues to increase and it is estimated that excess capacity is now about 486 million tons. We arrive at that number as follows; global capacity is about 2.3 billion tons. A reasonably sustainable capacity utilization is 90 percent therefore effective capacity is 2.07 billion tonnes. Currently production is at 1.584 B tonnes annualized. Therefore excess capacity is 486 million tonnes or 23.5 percent. This excess capacity is floating (literally!) around the world looking for a home and the US is an attractive destination partly because of the value of the US $. We don’t know how much of this excess capacity is in China but maybe a WAG would be 2/3. About 70 percent of China’s industry is government owned so making money is not the top priority. Maintaining jobs is. Declining steel demand abroad, decent demand in the US and a skyrocketing US dollar will be a headwind for US steel producers for the immediate future. There seems to be no reason to expect this to change at least through 2016.


