

Market Data

November 13, 2015
Shipments and Supply of Sheet Products through September 2015
Written by Peter Wright
The following article is another example of Premium level content that is not normally seen by our Executive level members. If you would like to learn more about upgrading your membership from Executive to Premium please contact our office: info@SteelMarketUpdate.com or by phone: 800-432-3475.
This report compares domestic mill shipments and total supply to the market. It quantifies market direction by product and enables a side by side comparison showing the degree to which imports have absorbed demand. Sources are the American Iron and Steel Institute and the Department of Commerce with analysis by Steel Market Update.
![]() Table 1 shows both supply and mill shipments of sheet products (shipments includes exports) side by side as a three month average for the periods July through September (Q3) for both 2014 and 2015.
Table 1 shows both supply and mill shipments of sheet products (shipments includes exports) side by side as a three month average for the periods July through September (Q3) for both 2014 and 2015.
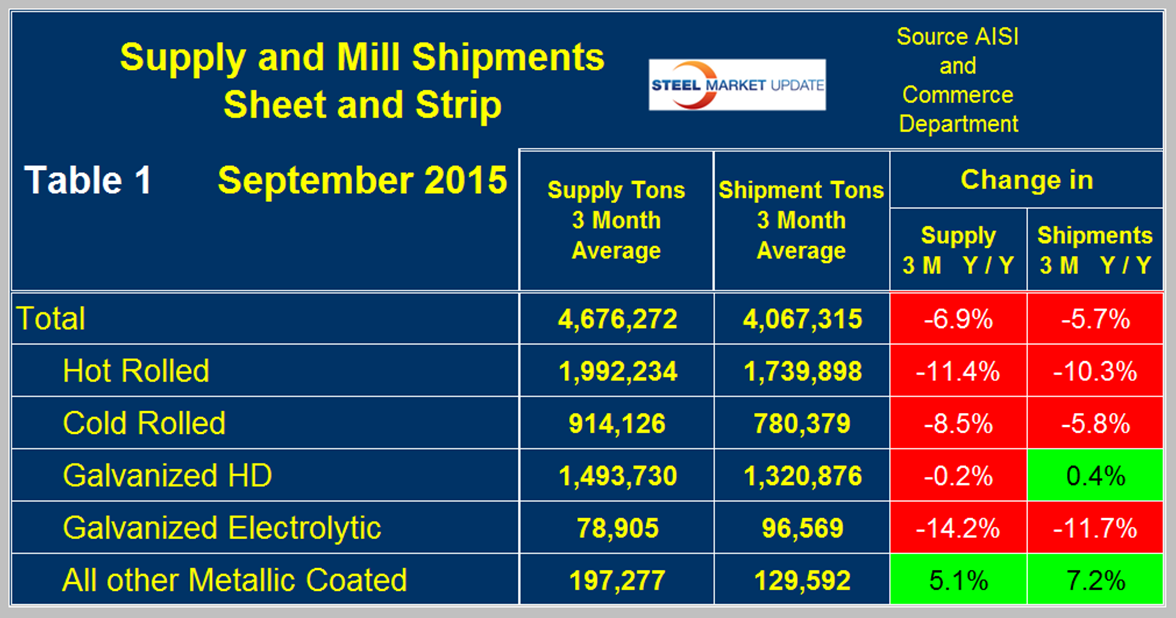
Comparing these two periods total supply to the market was down by 6.9 percent and shipments were down by 5.7 percent. These numbers have come into line after the recent months in which shipments declined much more than supply as imports took an increasing market share. Table 1 breaks down the total into the individual sheet products and it can be seen that there are no longer any significant discrepancies between the growth/contraction of shipment and the growth/contraction of supply. Supply of hot rolled was down by 11.4 percent and shipments were down by 10.3 percent, cold rolled supply was down by 8.5 percent as shipments were down by 5.8 percent. This means that in both cases imports gave up a little bit of ground. HDG shipments and supply were basically unchanged. For all three major segments of sheet products the results for September were worse than August. Electro galvanized which enjoys a trade surplus continued to have a greater decline in supply than it did in shipments. Other metallic coated products (mainly Galvalume) bucked the trend and continued to have positive growth is both supply and shipments with 5.1 percent and 7.2 percent respectively. The results for Galvalume were better than we reported for August. A review of supply and shipments separately for individual sheet products is given below.
Apparent Supply is a proxy for market demand and is defined as domestic mill shipments to domestic locations plus imports. In three months through September 2015 the average monthly supply of sheet and strip was 4,676,000 tons, down by 6.9 percent year over year as mentioned above. In nine months YTD supply was down by 4.6 percent which since the nine month decline was less than the twelve month decline means that momentum is positive and the decline is slowing. This is further reinforced by the comparison between Q3 and Q2 up where growth was positive 1.3 percent. Table 2 shows the change in supply by product on the same basis through September.
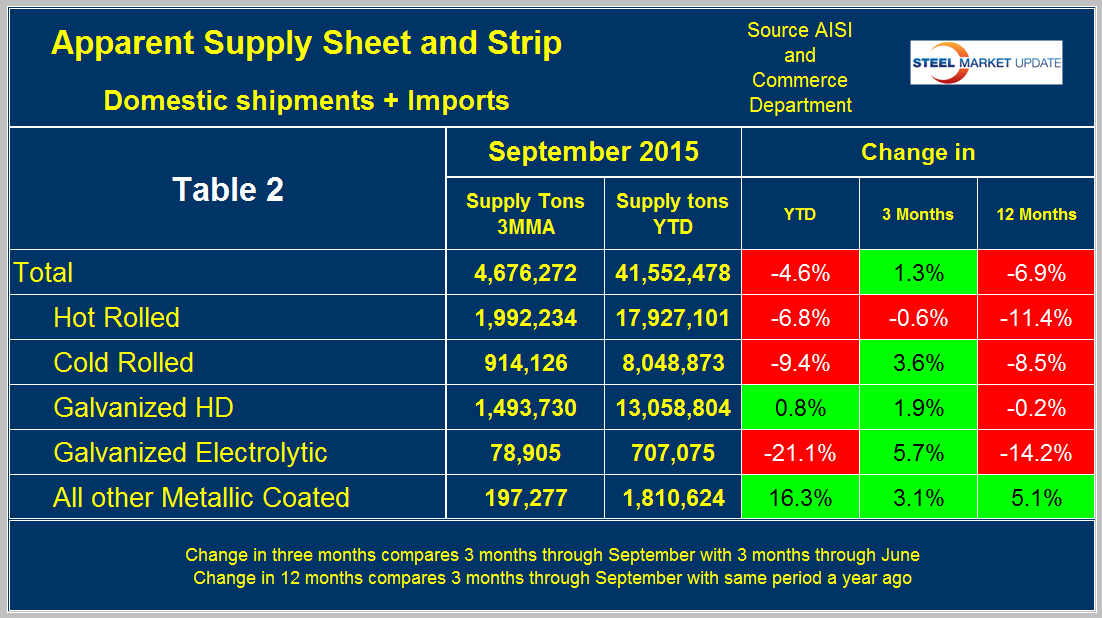
There is a big difference between products. HDG and Galvalume performing much better than hot and cold rolled sheet. Electro-galvanized had the worst performance YTD and year/year.
Figure 1 shows the long term supply picture for the three major sheet and strip products, HR, CR and HDG since January 2003 as three month moving averages.
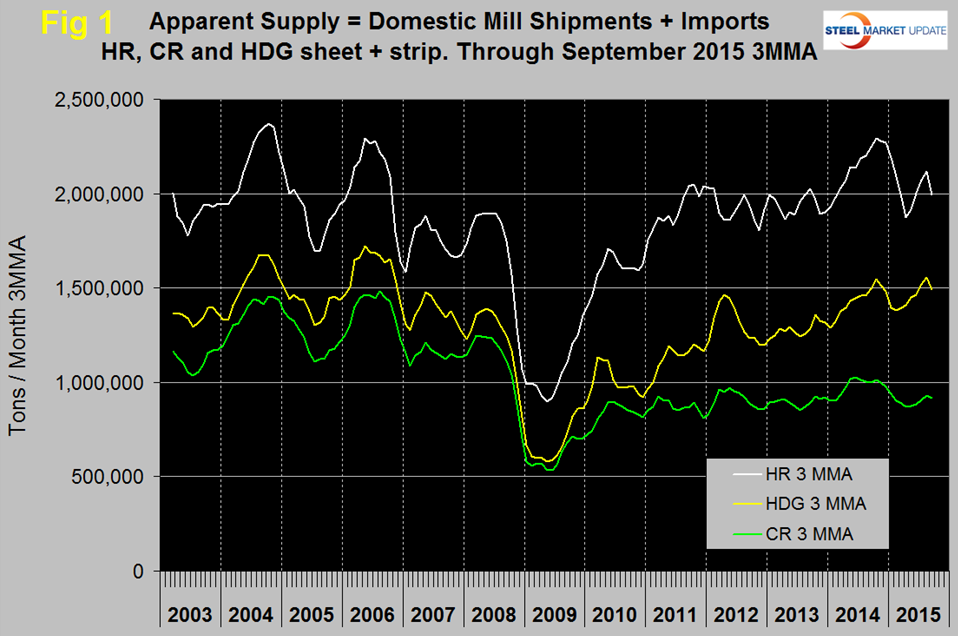
Hot rolled declined every month November through April then picked up in May, June, July and August before declining again in September. Cold rolled also declined in November through April, picked up more slowly in May through August and also declined in September. Hot dipped galvanized also exhibited a decline in September. In Q4 2014 all three were in higher demand than at any time since the recession. That is no longer the case for any of them though HDG is close.
Figure 2 shows import market share of sheet products and includes long products for comparison.
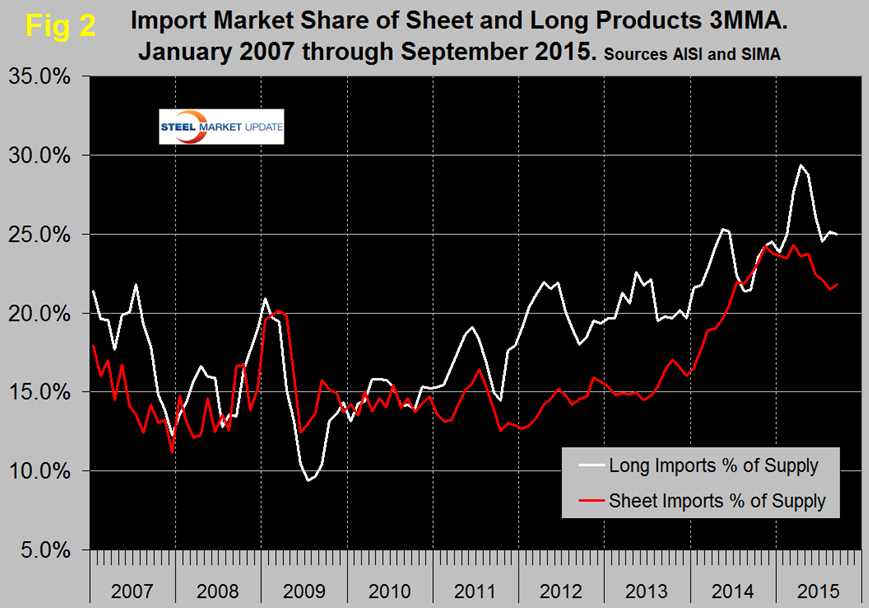
Based on a 3MMA the import market share of sheet products was 21.8 percent in September, up from 21.5 percent in August but still lower than at any time since June last year. The months November and March had the highest import market share since the beginning of the recovery. Import market share of long products in September 25.0 percent, down from 25.1 percent in August and down from the peak of 29.4 percent in April this year.
Mill Shipments. Table 3 shows that total shipments of sheet and strip products including hot rolled, cold rolled and all coated products were down by 5.7 percent year over year and down by 6.6 percent YTD.
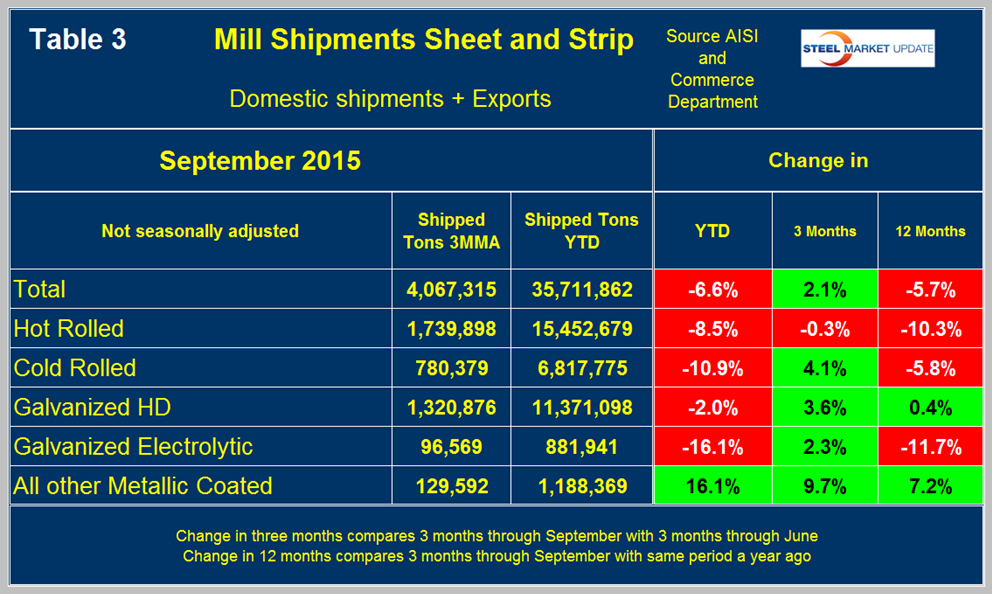
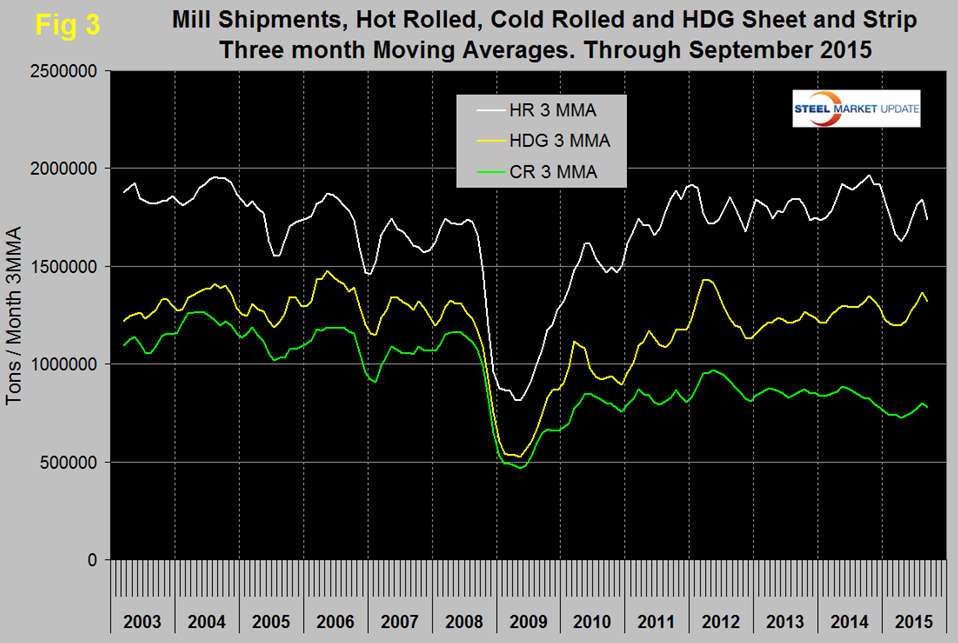
Shipments were up by 2.1 percent in Q3 compared to Q2. All the numbers in this report illustrate why it’s necessary to look at different time periods to get the whole picture. Individual products performed quite differently with other metallic coated faring the best and electro-galvanized the worst. Figure 3 puts these results into the long term context since January 2003.
SMU Comment: Based on the performance since the recession, steel demand is still up there but may be slowing in response to a reduced rate of manufacturing growth. We believe that manufacturing accounts for about 60 percent of steel consumption in the US and that figure is higher for sheet products than for longs. Import market share is still very high, longs being even worse than sheet products. However imports are no longer in the driver’s seat when it comes to absorbing market share. It is evident as we write many of the reports for publication in the Steel Market Update newsletters that it’s possible to slant an analysis anyway we want based on the time periods being examined. For that reason we always provide tabular data with short time period comparisons as well as graphical analysis of a much longer time frame. We hope this gives you the reader the best picture of what is going on, though, as we write, sometimes our comments can sound contradictory even to ourselves.


