

Market Data

November 22, 2015
Energy Myths Debunked
Written by Peter Wright
SMU contributing writer, Peter Wright, evaluates the oil and gas industry on a monthly basis for Steel Market Update. Energy markets are large users of hot rolled as well as pipe and tube steels. The energy market’s slowdown is one of the key reasons why the domestic steel industry has slowed this year.
Figure 1 shows historical gas and oil prices since January 2000. The daily spot price of West Texas Intermediate closed at $41.68 on November 16th, down from $45.91 on October 17th, according to the latest daily figure available from the Energy Information Administration (EIA).
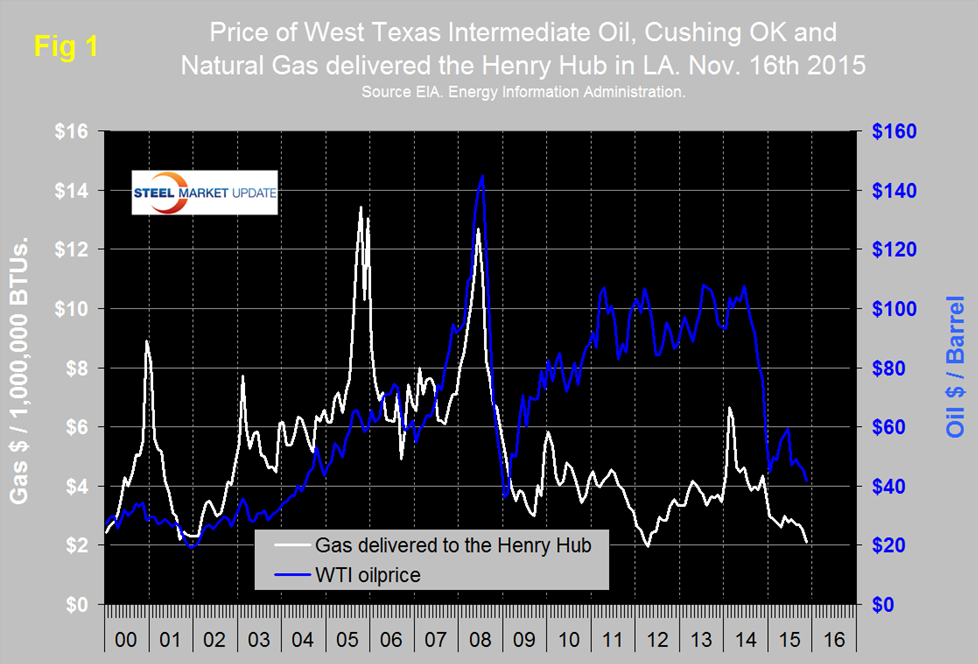
Brent closed at $40.28 on the same day. WTI was down from a recent high of $59.53 on June 15th. August was the 1st month since December 2010 for Brent to be lower than WTI. November was the 2nd. The current price of WTI is the lowest since February 2009. January 2009 at $36.00 was the low point of the commodity bust.
On October 16th Armada Executive Intelligence made the following points:
There have traditionally been four basic assumptions when it comes to the oil world and right now all four are in flux.
• The first asserts that oil is a fixed resource and one that is in decline. There will come a point when there is no more exploitable oil unless we are willing to pay outrageous prices for our fuel.
• The second asserts that nothing moves the oil markets other than demand and supply and the adjustment to changes in price will be very slow and halting.
• The third assumption is that oil flows from the Middle East to the Western states.
• The fourth is that OPEC has the ability to control the price of oil with their production decisions.
It is a bit of an overstatement but none of these statements are as true today as they were only a few years ago. Let’s take these one at a time.
The technology of oil extraction has advanced far beyond what anybody had expected just a few years ago and for all intents and purposes there is now an abundance of available oil and gas and at a price far cheaper than was the norm even three or four years ago. The price per barrel of oil is slated to stay in the vicinity of $60 or $70 for the next few years. There is really no sign of an oil shortage unless it is a manufactured one.
The second point is that only demand and supply moves the market and price changes are slow. That is no longer the case as major oil producers are now as concerned over market share as they are price and they do not necessarily react to price. Furthermore it has been obvious of late that price changes are fast and frequent. That is not likely to change either.
The third and fourth assumptions have been altered by the explosion of oil and gas development in the western hemisphere. The dominant nations in oil production are now Canada and the US and, in just a few years, they will be joined by Brazil and Mexico and perhaps even Colombia. This doesn’t mean that Africa and the Middle East no longer matter but they are slipping. That leads to the role of OPEC. The biggest oil players are not members and don’t want to be members – those that remain in OPEC no longer have the pricing power they once had and that is not going to come back. The bottom line is the future of the oil world will not look all that much like the oil world of even the recent past and this calls for a whole new approach.
The price of natural gas, delivered the Henry Hub in Louisiana closed at $2.11 on November 13th which is the latest data available. This was the lowest value since April 2012. The price has been trending down all year with an acceleration in the last few months. U.S. power stations are now reported to be generating more power from natural gas than from coal for the first time ever.
Figure 2 shows the apparent supply of the two main steel tubular products used in oil and gas production from January 2003 through September 2015.
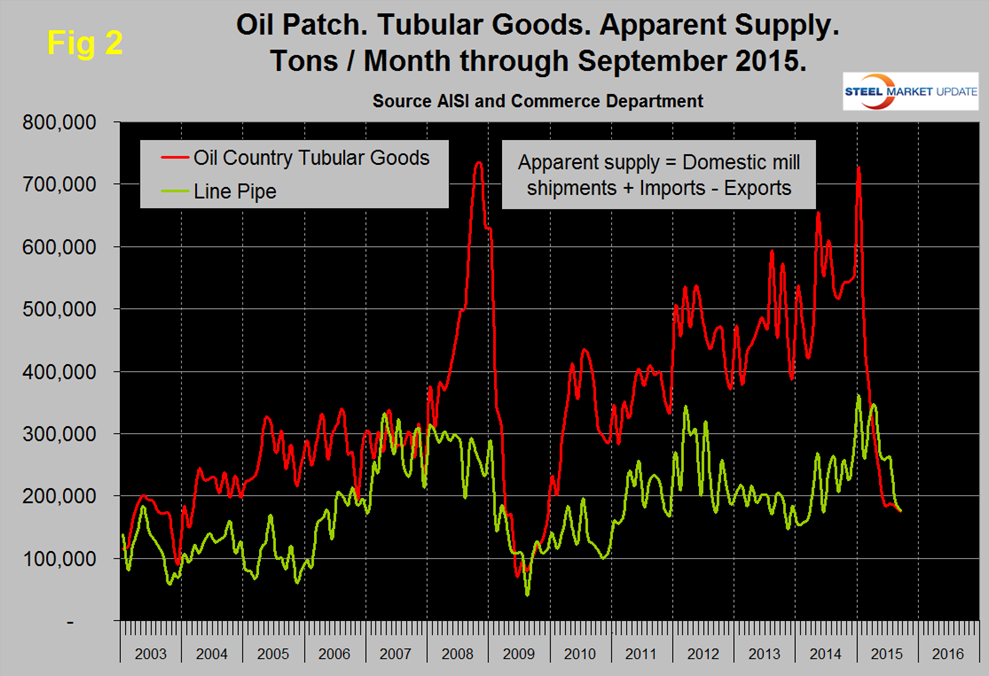
The demand for OCTG is now the lowest since November 2009, demand averaged about 600,000 tons per month from May 2014 through January this year but in three months through September has declined to an average of 185,000 tpm. Since January, line pipe has declined to a level not seen since Q2 last year.
Figure 3 shows the Baker Hughes US Rotary Rig Counts for oil and gas equipment through November 20th (Explanation below).
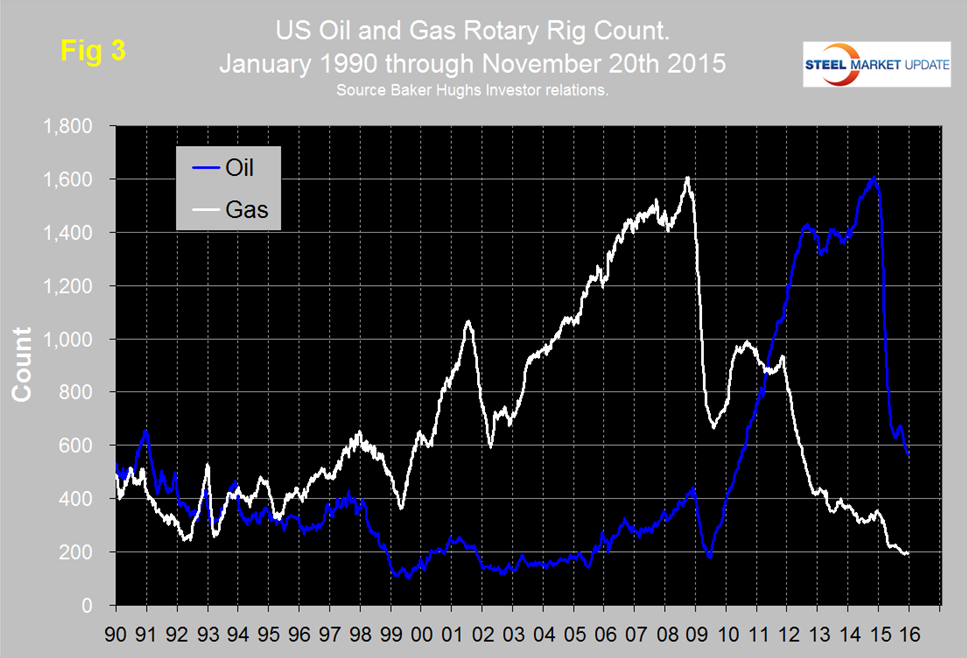
The total number of operating rigs in the US and Canada on November 20th was 923, down 54 in the last month and down from 2,018 on January 2nd. Year over year the total US and Canada rig count is down by 60.9 percent. The decline in the US oil rig count hesitated in July and August but since then has been continuous and was down by 30 in the last month. The decline in the oil rig count didn’t begin until October 10th last year, four months after the beginning of the oil price collapse. After a partial recovery in 2011 and 2012 the decline in the gas rig count has continued though the decline has been slower in the last few months.
On a regional basis in the US the big three states for operating rigs are Texas, Oklahoma and North Dakota. Texas at 340 on November 20th was down by 6 in the last month, Oklahoma at 81 was down by 9 and North Dakota at 63 was unchanged. North Dakota has only declined by 15 rigs in the last six months.
SMU’s view is that based on all we read, low oil prices could be with us for a while and the rig count has clearly not yet bottomed. Inventory adjustments must be playing a large part in the demand decline of OCTGs. We have no information detailing the proportion of oil field tubulars that are handled by service centers but assume it is small. The MSCI data combines all tubular products therefore may not be a good indicator for the oil field sector. What we do see from the MSCI data is a very slow response to a deteriorating market. Inventories of tubulars increased this year at the service center level until September and October when they declined by a total of 7.8 percent in two months (Figure 4).
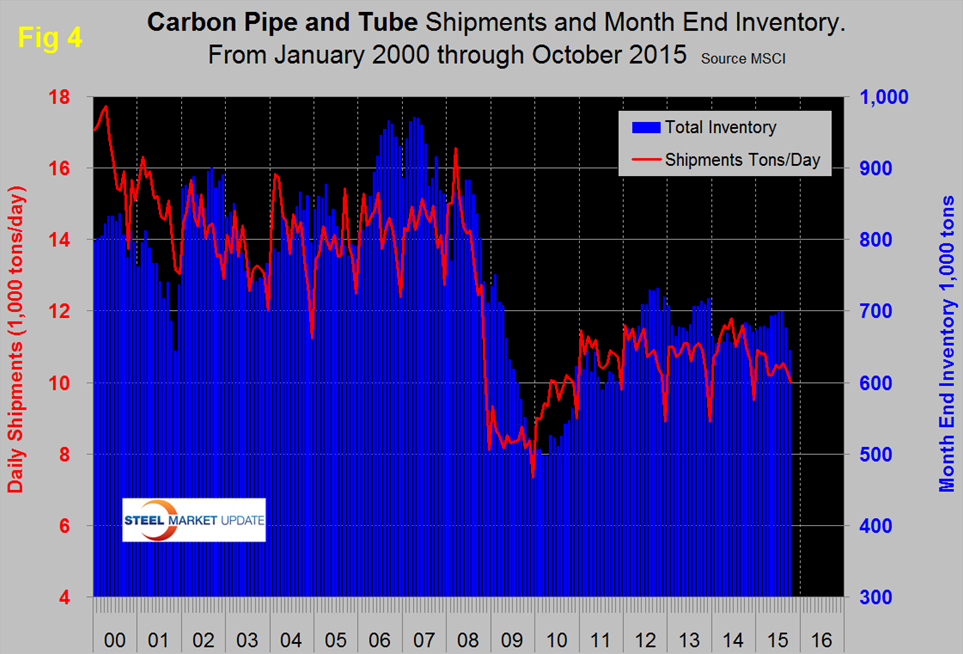
This discrepancy may be due to a strengthening of hollow structural shapes which would mitigate the decline in energy products.
The Baker Hughes rotary rig count is a weekly census of the number of drilling rigs actively exploring for or developing oil or natural gas in the United States. Rigs are considered active from the time they break ground until the time they reach their target depth and may be establishing a new well or sidetracking an existing one. The Baker Hughes Rotary Rig count includes only those rigs that are significant consumers of oilfield services and supplies.


