Market Data

November 22, 2015
SMU Survey Results: Demand is a Big Question Mark
Written by John Packard
Last week Steel Market Update conducted our mid-November flat rolled steel market analysis. We invited slightly less than 600 individuals representing more than 550 companies to participate. Of those responding 44 percent were connected to manufacturing companies, 41 percent with service centers/wholesalers, 7 percent with trading companies, 4 percent with steel mills, 3 percent with toll processors and 1 percent were listed as suppliers to the industry (such as a paint or chemical company).
SMU has been conducting our market analysis going back to late 2008. Over the years we have tweaked a number of our questions but there have been some key areas that existed since the beginning. We want to know how those actively involved in the flat rolled industry (mostly in purchasing or sales related positions) feel about their company’s ability to be successful (Sentiment Index), we want to know about lead times, steel mill negotiations, foreign steel purchases, changes to buying patterns and inventory management as well as pricing.
Another area we focus on is demand. We ask a number of questions throughout the process to see if there are any trends developing that we need to communicate to our readers (Premium as well as Executive).
We have seen a trend develop regarding demand going back to the middle of September. As you can see by the graphic below when we asked the entire group participating the percentage reporting demand as “declining” has been growing with 40 percent of all of our participants reporting this way last week.
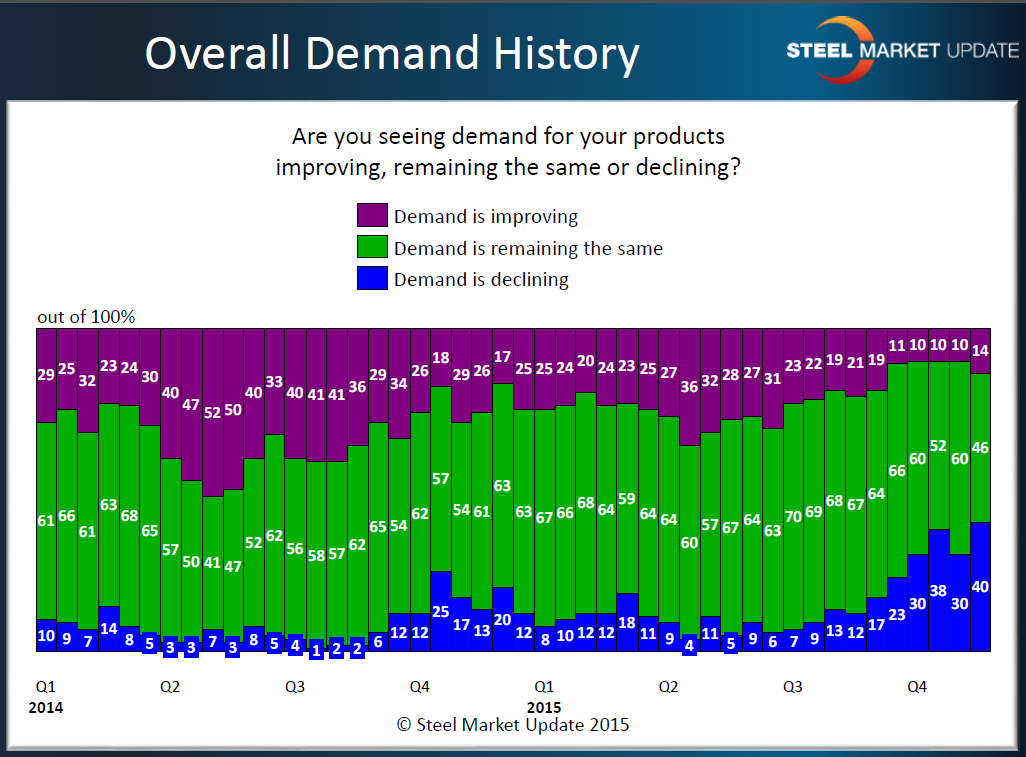
We also asked the entire group if their company was seeing a slowing trend in orders from their customers? Sixty-one percent of the respondents reported last week that they were indeed seeing a slowing in orders from their customers.
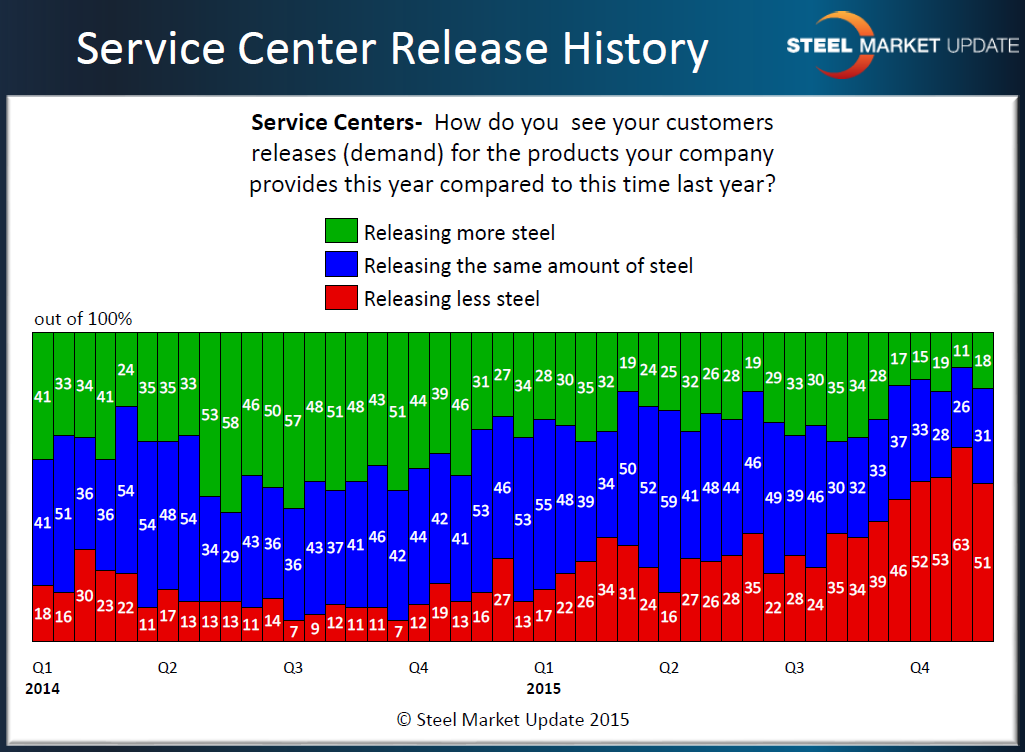
Service Centers Seeing Customers Releasing Less Steel
Flat rolled steel distributors have been reporting that their customers have been releasing less steel this year than they saw one year ago. At the beginning of November we hit a high with 63 percent of the service centers reporting their customers as releasing less steel. We improved slightly last week with only 51 percent reporting that way. To put this into perspective, last year in the middle of November only 16 percent reported their customers as releasing less steel.
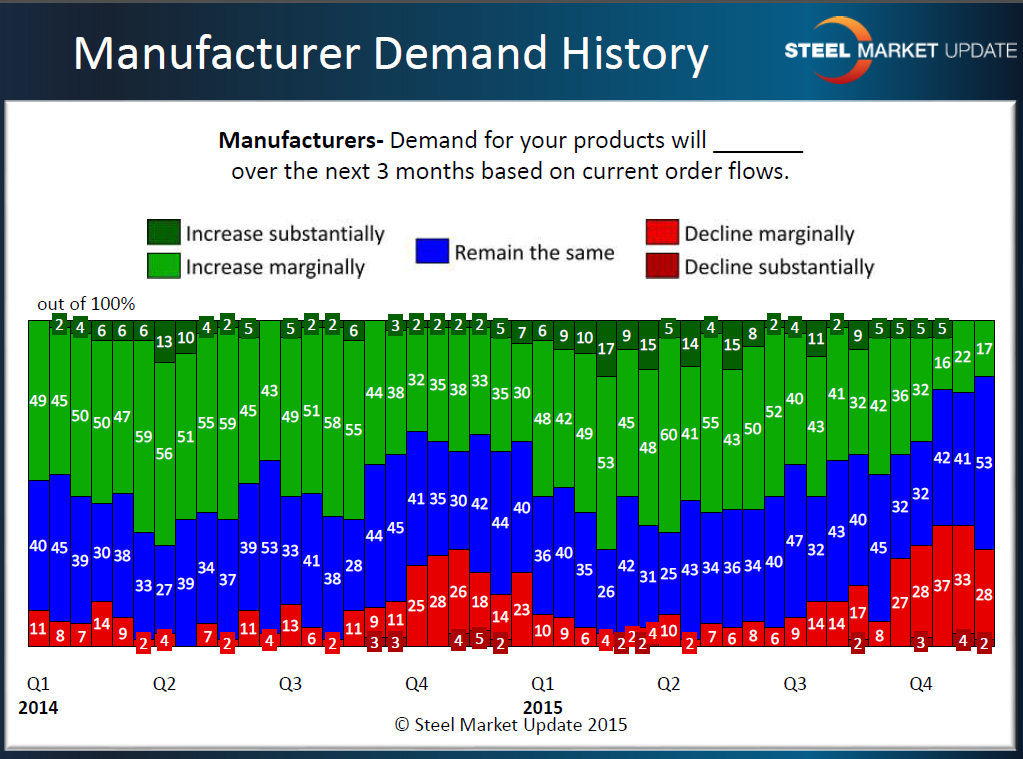
Manufacturing Companies Reporting Order Flows as…
SMU is most concerned with the following graphic, the graphic depicting how the manufacturing companies reported demand for their products over the next 3 months based on current order flows. It is not unusual to have seasonal issues impacting manufacturers businesses during the fourth quarter. You can see by the graphic there was a tick up in the bottom (red) bars which indicate that demand was expected to decline marginally during the next 3 months last year at this time.
This year those forecasting slowing demand has grown but, perhaps as troubling is the erosion of those companies who have been more optimistic about their demand scenarios. In this latest flat rolled market analysis only 17 percent of the manufacturers believed business would increase over the next 3 months. During all of 2014 the lowest reading we had for the green bars (optimistic group) was 32 percent, almost double the 17 reported this week and higher than what we have seen during our last 3 surveys going back to mid-October.