

Market Data

December 8, 2015
Distributor Spot Sale Prices Suggest Price Increase Imminent
Written by John Packard
Steel Market Update (SMU) has been analyzing service center spot pricing based on reports from manufacturing and distribution respondents to our flat rolled steel market questionnaire. SMU canvassed the market last week and we believe that the results suggests an uptick in spot pricing will come soon.
Manufacturing companies responding to our survey had 90 percent of their respondents reporting lower spot prices out of their service center suppliers. Manufacturers have been reporting their distributors as lowering spot prices in each of the past four survey periods (2 months).
At the same time, 68 percent of the service centers reported that their company was lowering spot pricing to their end user customers. This is down slightly from the 76 percent reported two weeks ago as well as the 75 and 80 percent calculated over the course of the previous survey.
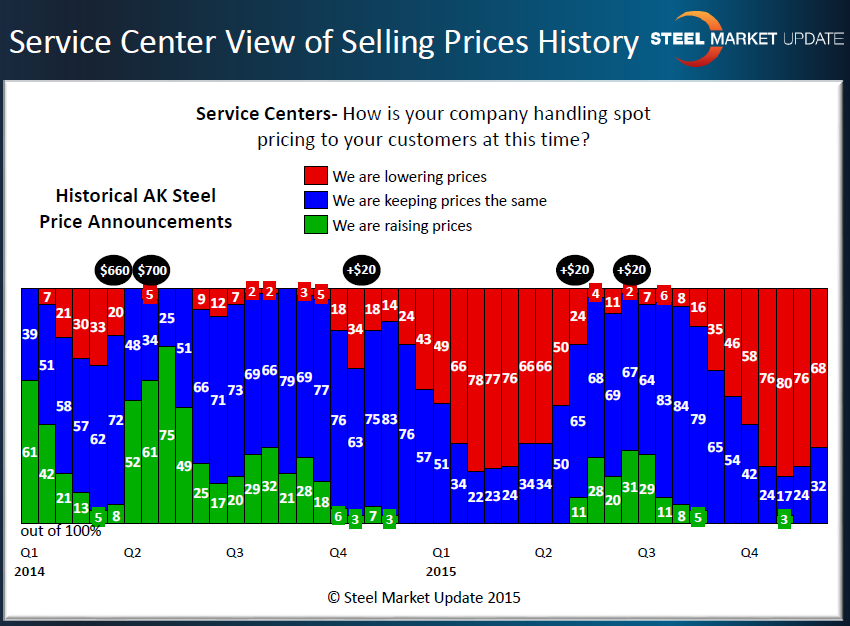
In the past, SMU has considered a response level at, or above, 75 percent as the level of capitulation at the distributors. At that level the pain associated with selling at continually cheaper pricing puts the industry in a mindset that would allow it to accept a price increase out of the domestic steel mills. Our opinion is we have been at that level, as we were earlier this year, and the odds of a price increase have been growing over the past week or two. This is also similar to what we saw earlier this year.
The question is if the mills do announce a public price increase (as a number of mills have indicated that they will only take new spot orders at higher prices already) will be see sideways movement, a dead cat bounce (short term bounce in prices) or a longer term rise in steel prices?


