

Market Data

December 18, 2015
Industrial Production and Manufacturing Capacity Utilization
Written by Peter Wright
Both of these data points are reported in the Federal Reserve G17 data base. The index had an all-time high of 107.9108 in November last year but on a month over month (m/m) basis has declined for nine of the first eleven months of 2015. This contrasts sharply with last year when in only one month did the m/m index decline.
On a year over year basis using a three month moving average (3MMA) growth became negative in November for the first time since February 2010. The November y/y decline was very slight at -0.03 percent but was a significant drop from last month when growth was +0.85 percent and down from +4.5 percent in January (Figure 1).
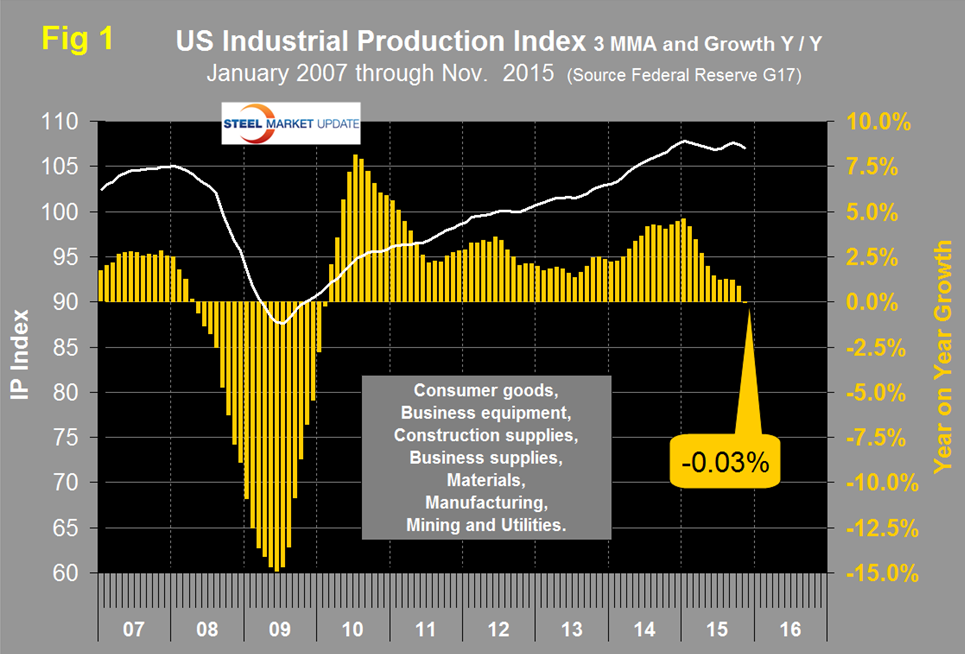
Data is seasonally adjusted and the index is based on the May 2012 level being defined as 100.
The Federal Reserve summary for the November data reads as follows:
“Industrial production declined 0.6 percent in November after decreasing 0.4 percent in October. In November, manufacturing production was unchanged from October. The index for utilities dropped 4.3 percent, as unusually warm weather held down the demand for heating. The index for mining fell 1.1 percent in November, with much of this decrease attributable to sizable declines for coal mining and for oil and gas well drilling and servicing. At 106.5 percent of its 2012 average, total industrial production in November was 1.2 percent below its year-earlier level. Capacity utilization for the industrial sector declined 0.5 percentage point in November to 77.0 percent, a rate that is 3.1 percentage points below its long-run (1972–2014) average.”
(Industrial production has sub components, manufacturing, mining and utilities). Regarding manufacturing the Fed had this to say:
Manufacturing output was unchanged in November, as the output of non-durable goods gained 0.5 percent, but the production of durable goods declined 0.2 percent and the index for other manufacturing industries (publishing and logging) moved down 1.7 percent. Most non-durable goods industries recorded increases, with the largest gain posted by the food, beverage, and tobacco products category. Among durable goods industries, losses of 1.0 percent or more were recorded by primary metals; electrical equipment, appliances, and components; and motor vehicles and parts. The production of nonmetallic mineral products increased 1.2 percent for the largest gain among durables. Mining output declined 1.1 percent in November and was 8.2 percent below its year-earlier level, with the index for oil and gas well drilling and servicing at less than half of its year-earlier level.
MAPI (Manufacturing Alliance for Productivity and Innovation) had a more positive spin on the November IP data and published the following is in their blog this week.
“The Federal Reserve Board’s index of industrial output declined 0.6 percent in November,” noted Don Norman, Ph.D., director of economic studies for the MAPI Foundation. “The decline was a consequence of warm weather that lowered the utilities index by 4.3 percent as the demand for electricity, heating oil, and natural gas that normally rises with the onset of winter instead fell. In addition, the decline in oil and natural gas prices reduced drilling activity and resulted in a 1.1 percent fall in the mining index. In contrast, the manufacturing index was unchanged in November. The index has been up and down throughout 2015 and overall it has changed very little,” he added. On a year-over-year basis, the index is a mere 1 percent above its November 2014 level. Within manufacturing, output of non-durable goods was up 0.5 percent, perhaps a reflection of increased spending by consumers in response to lower energy prices. The index for durable goods fell 0.2 percent in November; the decline was led by decreases in the indexes for primary metals, electrical equipment and appliances, aerospace, and motor vehicles and parts. It should be emphasized that the individual indexes for durable goods industries tend to be volatile on a month-to-month basis. U.S. manufacturers have faced numerous challenges in 2015, including a much stronger dollar, heightened uncertainty about slowing economic growth in China, and the dramatic fall in the prices of oil and natural gas—a decline that has proven to be a two-edged sword. Given these challenges, the fact that manufacturing production is up even mildly is a positive sign.”
Manufacturing capacity utilization was 76.23 percent in November with a 3MMA of 76.22 percent (Figure 2).
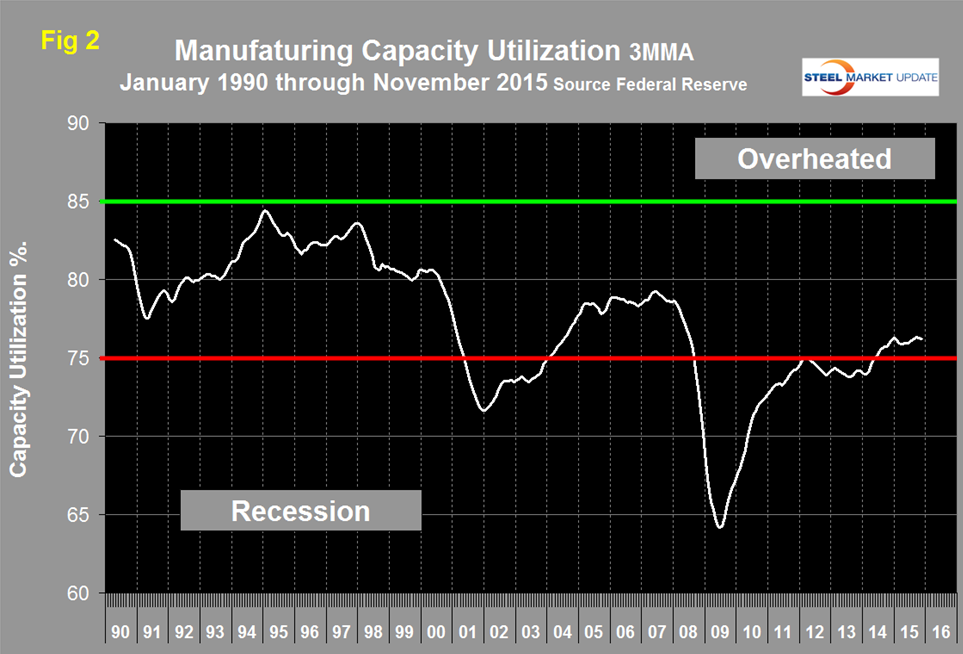
There was a recent peak of 76.27 percent in the 3MMA in January which declined to 75.87 in March and since then there has been a slight improvement to the present value.
Regarding the November result the Fed had this to say: The capacity utilization rate for manufacturing edged down to 76.2 percent, a rate 2.3 percentage points below its long-run average. The operating rate for durable goods manufacturing moved down 0.3 percentage point, while the operating rate for non-durable goods manufacturing moved up 0.4 percentage point. Utilization for other manufacturing (publishing and logging) decreased 0.9 percentage point. The operating rate for mines dropped 1.1 percentage points to 79.4 percent, while capacity utilization for utilities fell 3.4 percentage points to 74.5 percent.
SMU Comment: The IP data is similar to the ISM Manufacturing Index which also contracted very slightly in November after expanding at a decreasing rate since October last year. Figure 3 shows the ISM manufacturing index since January 1997.
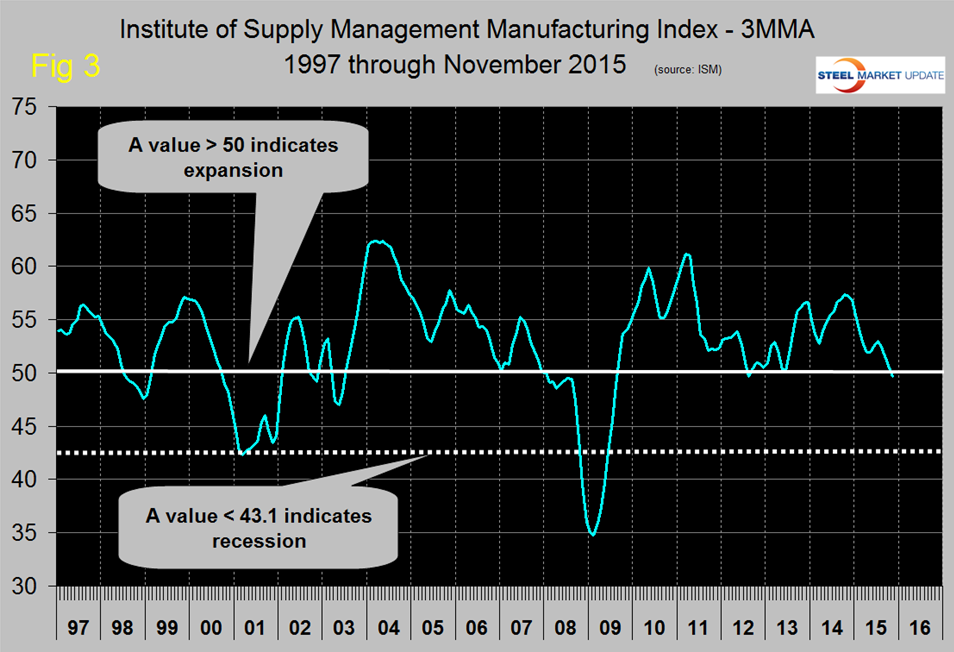
Any value >50 indicates expansion. At SMU we try to examine two or three measures of the same activity as a reality check and on this basis together with the manufacturing employment numbers that we have previously published we think that MAPI may have too positive a spin on this latest IP data.


