

Market Data

December 23, 2015
Producer Price Indexes of Sheet Steel, Aluminum, Plastic and Transportation - November 2015
Written by Peter Wright
Each month the Bureau of Labor Statistics (BLS) puts out its series of producer price indexes, for thousands of goods and materials. For an explanation of this program see the end of this piece. The latest release last week reported results through November. We run this analysis every three or four months to give readers an opportunity to become aware of any changes in the competitive position of steel against other materials and rail vs truck transportation.
![]() The PPI data are helpful in monitoring the price direction of steel and steel products against competing materials and products. As far as we at SMU can tell from comparison with known transaction prices, these PPI are a good representation of the real world. However our observation is that the actual values of the PPIs of different products cannot be compared with one another because they are developed by different committees within the BLS. We believe that this data is useful only in comparing the direction of prices in the short and medium term.
The PPI data are helpful in monitoring the price direction of steel and steel products against competing materials and products. As far as we at SMU can tell from comparison with known transaction prices, these PPI are a good representation of the real world. However our observation is that the actual values of the PPIs of different products cannot be compared with one another because they are developed by different committees within the BLS. We believe that this data is useful only in comparing the direction of prices in the short and medium term.
The November report from the BLS has been abridged by SMU staff as follows;
The Producer Price Index for final demand increased 0.3 percent in November, seasonally adjusted. Final demand prices decreased 0.4 percent in October and 0.5 percent in September. On an unadjusted basis, the final demand index fell 1.1 percent for the 12 months ended in November, the tenth consecutive 12-month decline. The November rise in the final demand index can be traced to prices for final demand services, which advanced 0.5 percent. In contrast, the index for final demand goods moved down 0.1 percent. Within intermediate demand, the index for processed goods fell 0.6 percent, prices for unprocessed goods dropped 5.1 percent, and the index for services was unchanged.
The index for final demand goods inched down 0.1 percent in November, the fifth consecutive decrease. Over 90 percent of the November decline can be traced to prices for final demand energy, which fell 0.6 percent. The index for final demand goods less foods and energy edged down 0.1 percent. Half of the November decrease in the index for final demand goods is attributable to prices for gasoline, which fell 1.3 percent. The indexes for residential natural gas, electric power, carbon steel scrap, and corn also moved lower. Prices for processed goods for intermediate demand moved down 0.6 percent in November, the fifth straight decline. In November, nearly half of the broad-based decrease can be traced to the index for processed energy goods, which fell 1.7 percent. Prices for processed materials less foods and energy and for processed foods and feeds both declined 0.4 percent. For the 12 months ended in November, the index for processed goods for intermediate demand fell 7.1 percent, the smallest decline since a 7.0 percent decrease in the 12 months ended August 2015. A major factor in the November decline in prices for processed goods for intermediate demand was the index for electric power, which fell 1.2 percent. Prices for iron and steel, primary basic organic chemicals, natural gas to electric utilities, diesel fuel, and soybean cake and meal also decreased. In contrast, the index for jet fuel increased 3.9 percent. Prices for softwood lumber and for beef and veal also advanced.
For the purpose of this report, we at SMU have extracted comparative statistics for sheet steel, aluminum and plastic products and truck and rail transportation. Table 1 is a summary of each category on a year over one, two and three year basis.
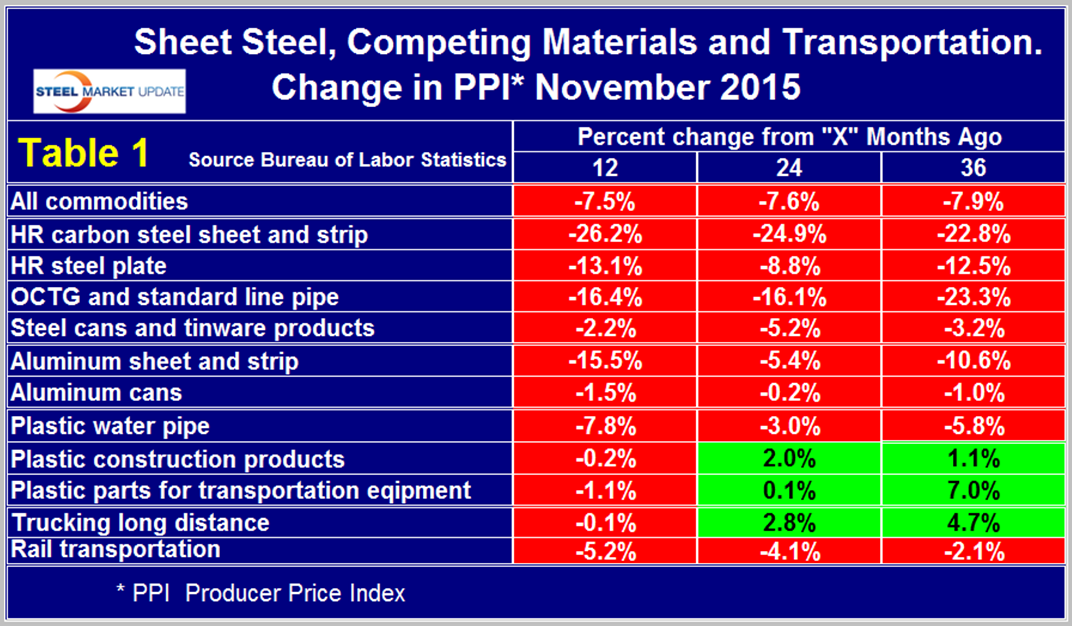
Our analysis of the PPI data shows that commodity prices as a whole declined by 7.5 percent in 12 months through November and were also down on a two and three year comparison. The decline on this basis is quite consistent. Commodity prices in general were back to where they were over five years ago in October 2010. A rising $ will put downward pressure on commodity prices and the demand side of the equation is exacerbating currency effects at this time. Of particular interest in this analysis is that the decrease in price of both steel and aluminum cans continues to bear no relationship to their raw sheet products. In a similar vein the prices of plastic construction products and plastic parts for transportation equipment have declined very little in the last 12 months in spite of the collapse in hydrocarbon prices. In the last 12, 24 and 36 month periods hot rolled steel sheet and strip have declined in price by much more than aluminum sheet and strip.
Table 1 also shows price changes for truck and rail transportation and indicates that rail has declined much more than truck in the last 12 months.
The official description from the Bureau of Labor Statistics (BLS) reads as follows:
The Producer Price Index (PPI) is a family of indexes that measure the average change over time in the prices received by domestic producers of goods and services. PPIs measure price change from the perspective of the seller. This contrasts with other measures, such as the Consumer Price Index (CPI). CPIs measure price change from the purchaser’s perspective. Sellers’ and purchasers’ prices can differ due to government subsidies, sales and excise taxes, and distribution costs. More than 9,000 PPIs for individual products and groups of products are released each month. PPIs are available for the products of virtually every industry in the mining and manufacturing sectors of the U.S. economy. New PPIs are gradually being introduced for the products of industries in the construction, trade, finance, and services sectors of the economy. More than 100,000 price quotations per month are organized into three sets of PPIs: (1) Stage-of-processing indexes (2) commodity indexes, and (3) indexes for the net output of industries and their products. The stage-of processing structure organizes products by class of buyer and degree of fabrication. The commodity structure organizes products by similarity of end use or material composition. The entire output of various industries is sampled to derive price indexes for the net output of industries and their products.


