

Market Data

January 7, 2016
SMU Steel Buyers Sentiment Index: 3MMA Slide Has Stopped
Written by John Packard
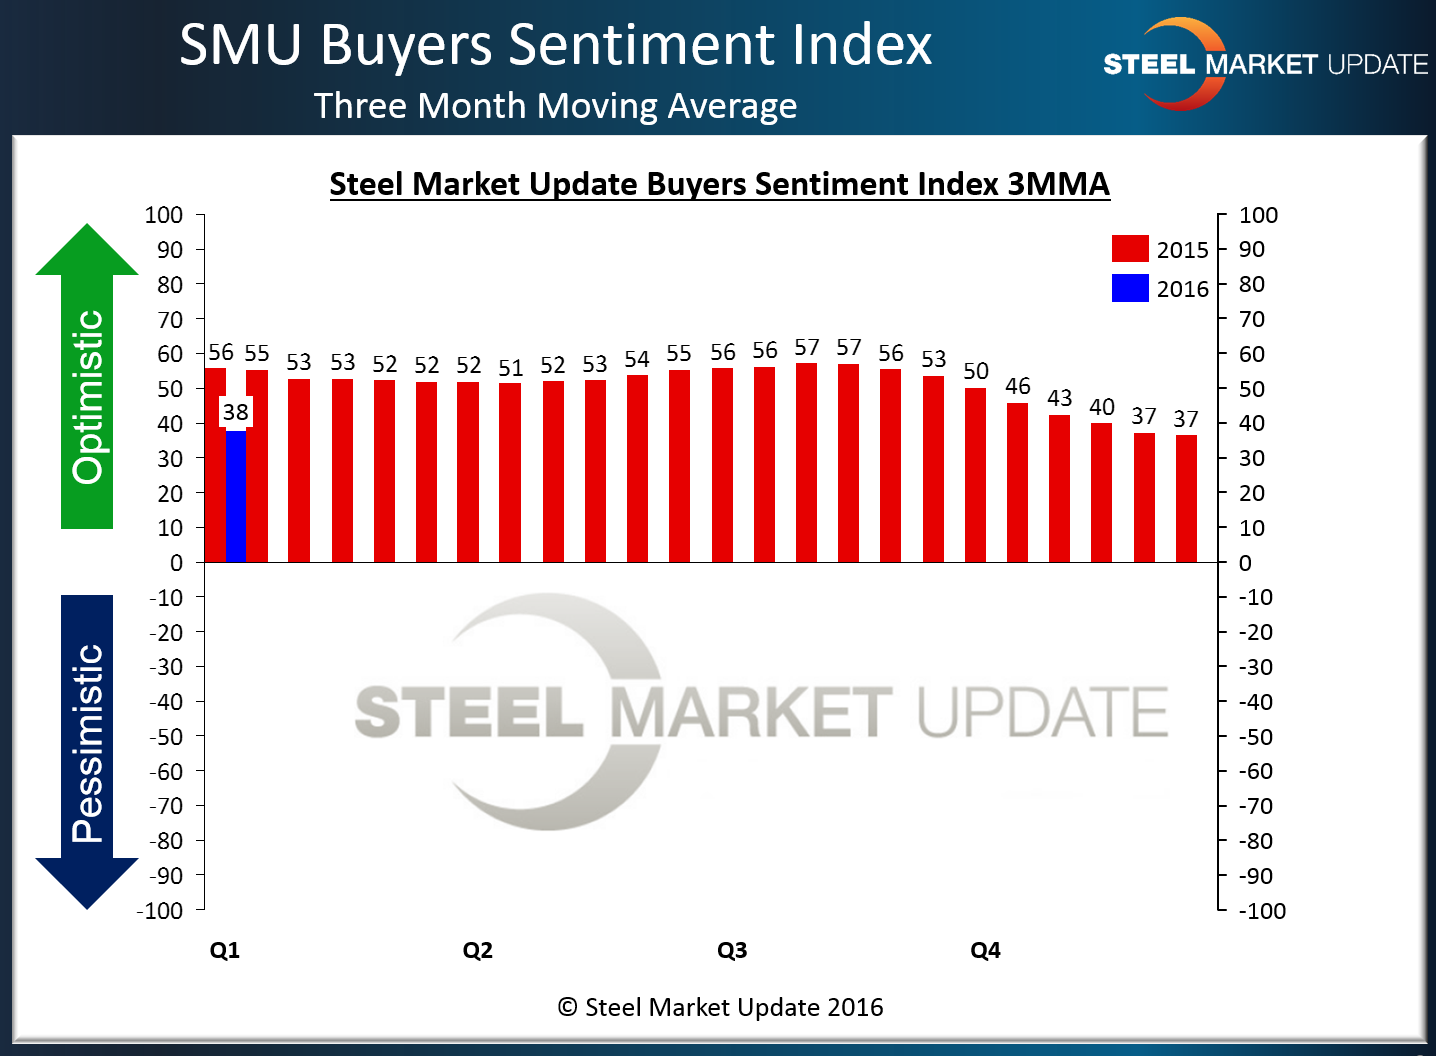
Buyers and sellers of flat rolled steel are slowly beginning to feel better about their company’s prospects both now and into the future, according to the results of the Steel Market Update (SMU) flat rolled steel market analysis just completed earlier today. SMU is reporting current market sentiment as being up +1 point to +44. The +44 is the highest level seen for our index since the middle of September.
As our readers know, looking at monthly (or in this case one set of data points from a survey which is conducted twice a month) data can be misleading. We like to “smooth out” the data by using a three month moving average (3MMA) and the 3MMA for our Current (business conditions now) Steel Buyers Sentiment Index is +37.67 and is higher than the prior 3MMA for the first time since mid-July 2015!
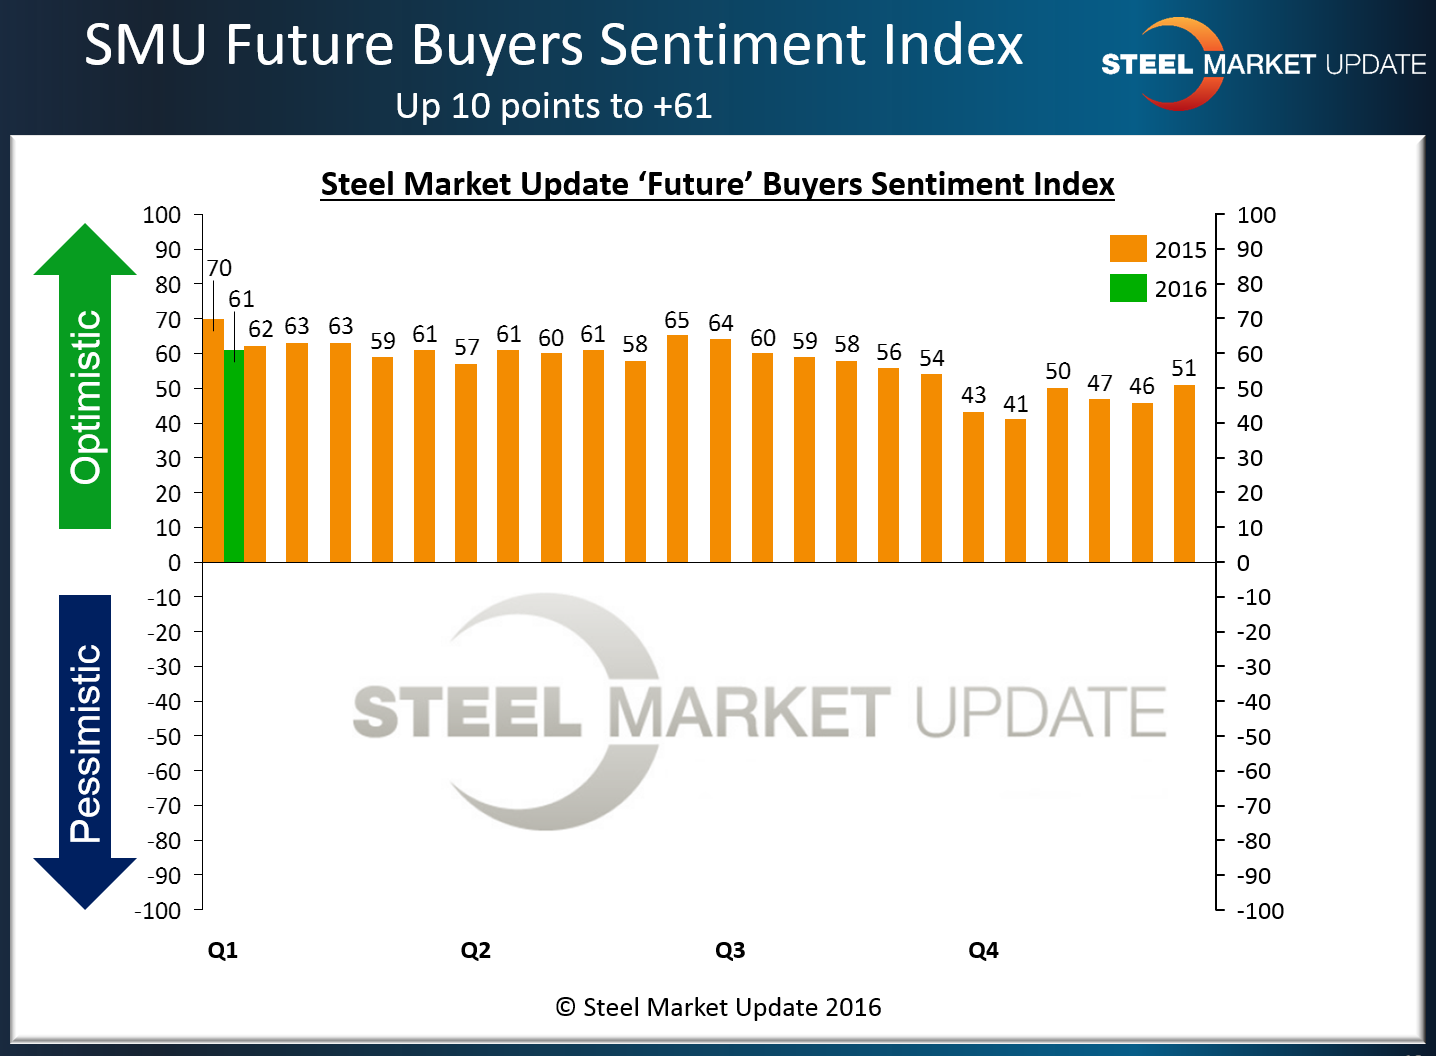
Steel Market Update also looks at how buyers and sellers of flat rolled steel feel about their company’s ability to be successful three to six months into the future. The results are tabulated in our Future Steel Buyers Sentiment Index which this week shot up by +10 points to +61 which is a very optimistic reading (but below the +70 recorded at the beginning of January 2015).
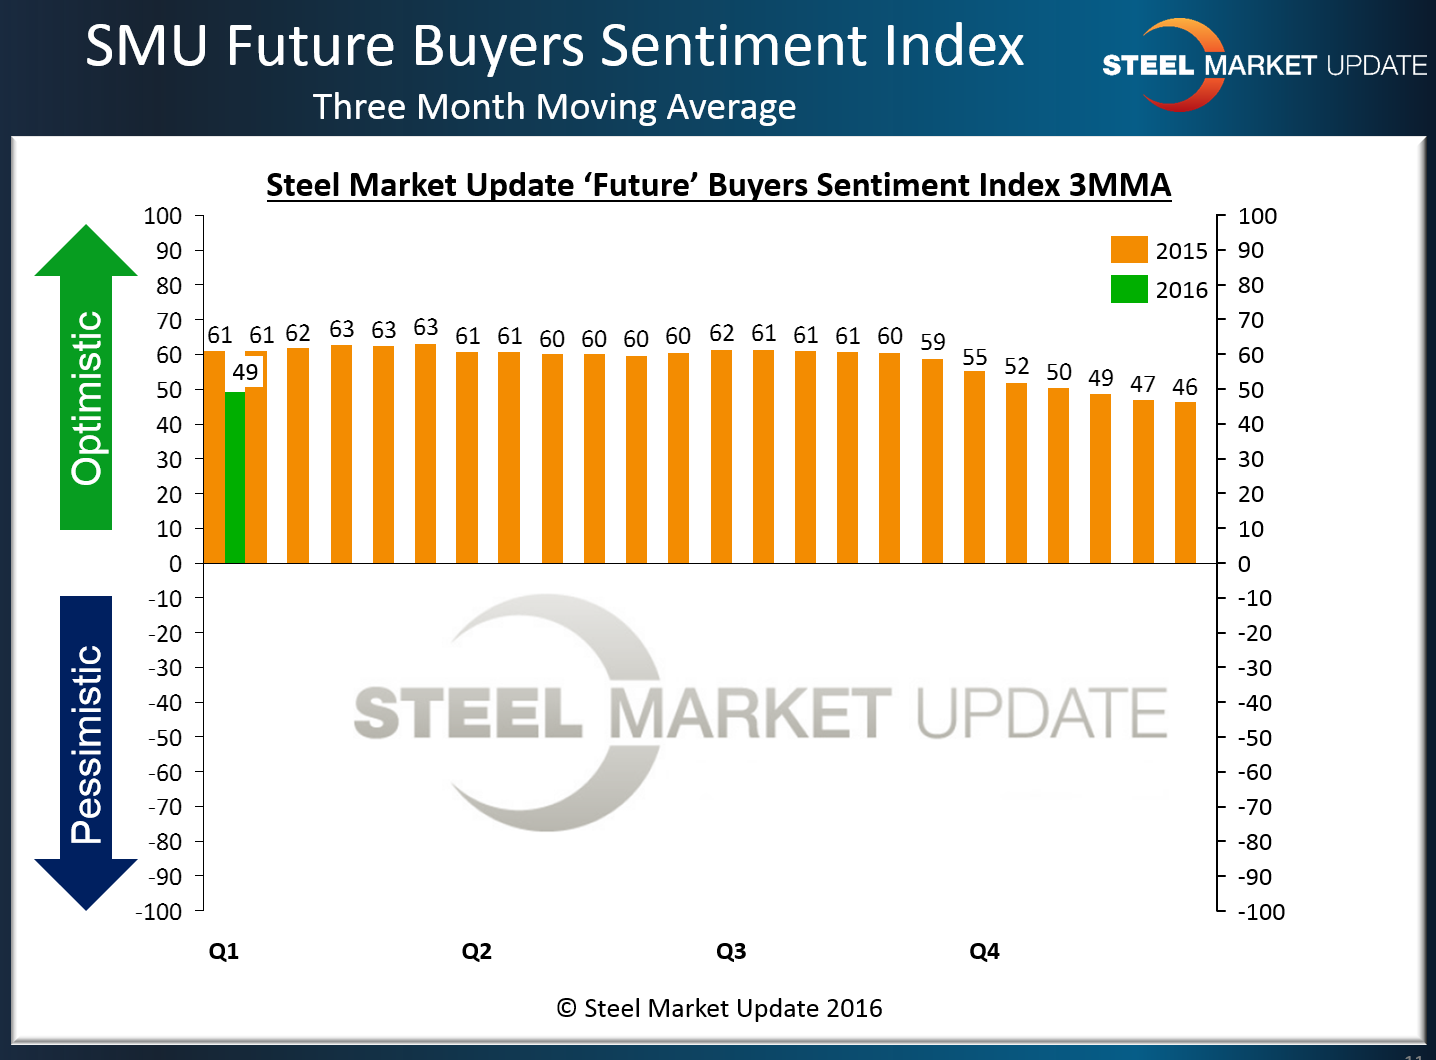
Again, we want to take the bumps out of the numbers by looking at the data in the form of a 3 month moving average and there we see a similar trend that we saw with Current Sentiment 3MMA as the negative trend has been broken to the upside for the first time since the beginning of July 2015.
What Our Respondents are Saying
“Plate market appears to be turning around in the positive direction.” Service center
” We are seeing a decline in orders due to the US Steel mill shut down in Granite City.” Toll processor
“We had a 30% increase in pounds from 2014/2015. Great year even in a down market. We are planning on another 30% increase in pounds due to 2015 plant acquisitions.” Manufacturing company
“The market has a long way to go, but there is no reason why we will not succeed in 2016.” Steel mill
About the SMU Steel Buyers Sentiment Index
SMU Steel Buyers Sentiment Index is a measurement of the current attitude of buyers and sellers of flat rolled steel products in North America regarding how they feel about their company’s opportunity for success in today’s market. It is a proprietary product developed by Steel Market Update for the North American steel industry.
Positive readings will run from +10 to +100 and the arrow will point to the right hand side of the meter located on the Home Page of our website indicating a positive or optimistic sentiment.
Negative readings will run from -10 to -100 and the arrow will point to the left hand side of the meter on our website indicating negative or pessimistic sentiment.
A reading of “0” (+/- 10) indicates a neutral sentiment (or slightly optimistic or pessimistic) which is most likely an indicator of a shift occurring in the marketplace.
Readings are developed through Steel Market Update market surveys which are conducted twice per month. We display the index reading on a meter on the Home Page of our website for all to enjoy.
Currently, we send invitations to participate in our survey to almost 600 North American companies. Our normal response rate is approximately 110-170 companies. Of those responding to this week’s survey, 44 percent were manufacturing and 40 percent were service centers/distributors. The balance of the respondents are made up of steel mills, trading companies and toll processors involved in the steel business.
Click here to view an interactive graphic of the SMU Steel Buyers Sentiment Index or the SMU Future Steel Buyers Sentiment Index.


