

Prices

January 15, 2016
Net Imports of Sheet Products Through November
Written by Peter Wright
Net imports equals imports minus exports. We regard this as an important look at the overall trade picture and its effect on demand at the mill level. Figure 1 shows that net sheet product imports on a three month moving average (3MMA) basis at 546,093 tons in November continue to be more than double that which existed before the recession but declined in the first 11 months of 2015.
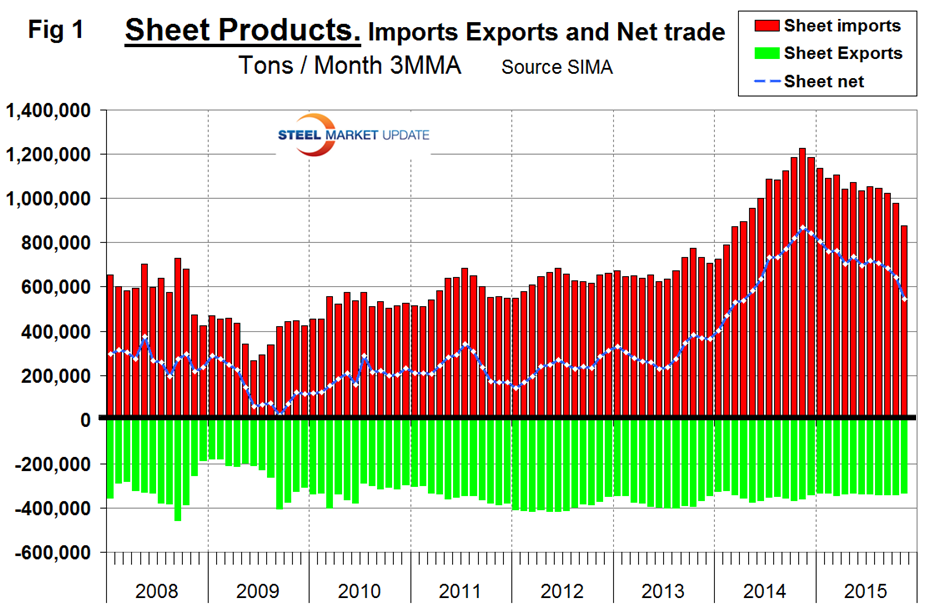
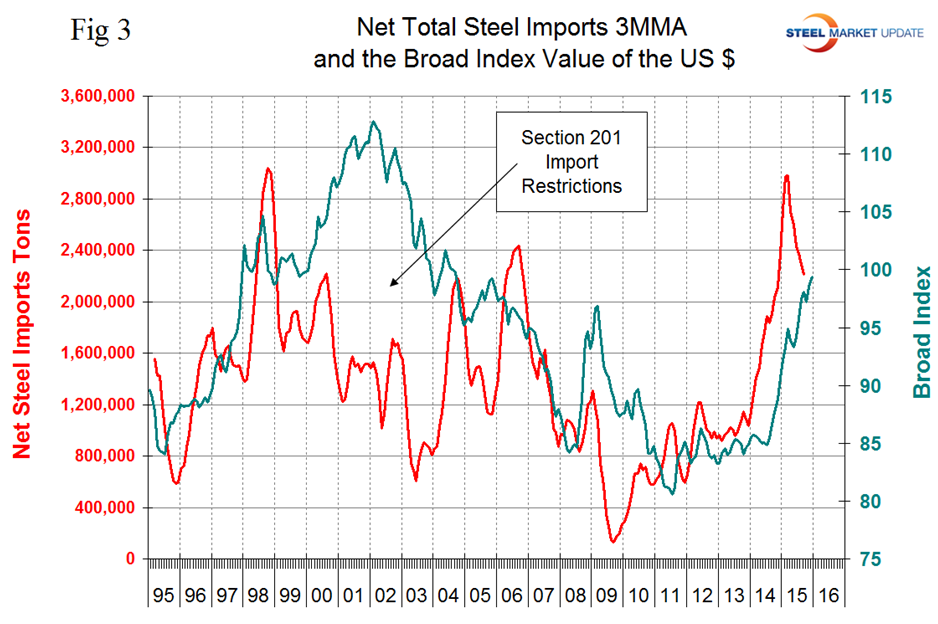
Compared to imports, exports have been relatively consistent for almost eight years. Table 1 shows net imports by product.
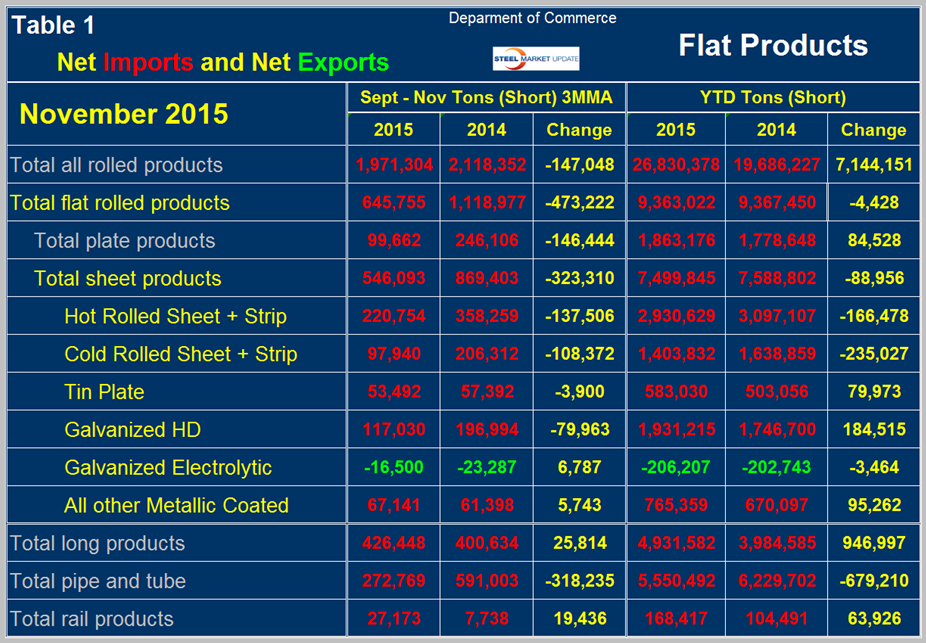
Year to date through November, total net flat rolled imports were 9,363,000 tons, down by 4,000 tons year over year. Of this total, 7,500,000 tons were sheet products, down by 99,000 tons. On a three month moving average basis (3MMA), September through November, net sheet imports decreased by 323,000 tons per month year over year. The 3MMA of net imports decreased y/y on all sheet steel products except other metallic coated products. Electro-galvanized is the only sheet product that currently enjoys net exports and in September through November that surplus declined year over year. In Table 1 negative net imports (which means a trade surplus) are shown in green. Figure 2 shows the trend of monthly net sheet product imports since January 2011 on a 3MMA basis.
Net hot rolled imports declined sharply in January through April but reversed course in May through August before declining again in October and November. HDG has declined steadily since mid-year. Cold rolled net imports have declined steadily since November 2014.
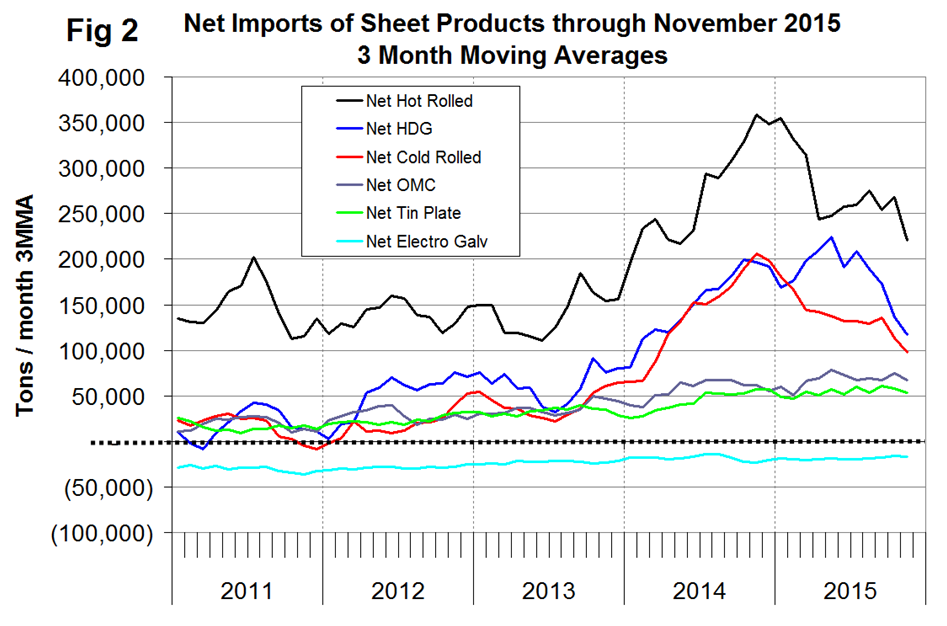
Net sheet steel imports are still strong by historical standards and we believe there are two main drivers. The trade weighted value of the US $ is increasing which makes our exports less attractive to foreign buyers. It makes the US domestic market more attractive to foreign sellers because they reap more in their own currencies and it makes imports more attractive to domestic buyers. Figure 3 shows the relationship between net imports and the value of the $ since January 2011.
The divergence in the early 2000s was a result of “Section 201” import controls, over stocked service centers and a strong decline in US demand. The strengthening of the dollar is expected to accelerate as the Fed continues to raise interest rates. The second reason is that steel demand in the US is relatively strong at the same time as global demand growth has softened. Global steel production contracted by 3.9 percent year over year in 3 months through November and that trend is accelerating. Global steel capacity continues to increase and it is estimated that excess capacity is now about 486 million tons or 23.5 percent. This excess capacity is floating (literally!) around the world looking for a home and the US is an attractive destination partly because of the value of the US $. We don’t know how much of this excess capacity is in China but maybe a WAG would be 2/3. About 70 percent of China’s industry is government owned so making money is not the top priority. Maintaining jobs is. Declining steel demand abroad, decent demand in the US and a skyrocketing US dollar will be a headwind for US steel producers for the immediate future. There seems to be no reason to expect this to change at least through 2016.


