Market Data

January 24, 2016
SMU Survey: Demand Trends Changing
Written by John Packard
Twice per month, Steel Market Update (SMU) produces our flat rolled steel market analysis. This is done through the use of an online questionnaire which is accessed by an invitation only link. SMU invites just under 600 companies associated with the flat rolled industry with a major focus on manufacturing companies and steel distributors.
Our most recent analysis was conducted last week and, of those responding 46 percent were manufacturing companies, 40 percent were distributors and the balance was made up of trading companies (7 percent), steel mills (4 percent) and toll processors (3 percent).
We reported late last week how our Sentiment Index, both Current and Future, have over the past 30 days broken out of the cycle that had been plaguing the industry for a number of months going back to last summer. The rise in optimism is a good sign for the steel industry as buyers and sellers are buoyed by the determination of the domestic mills to first stabilize and then increase steel prices. This has been accomplished over the last six weeks.
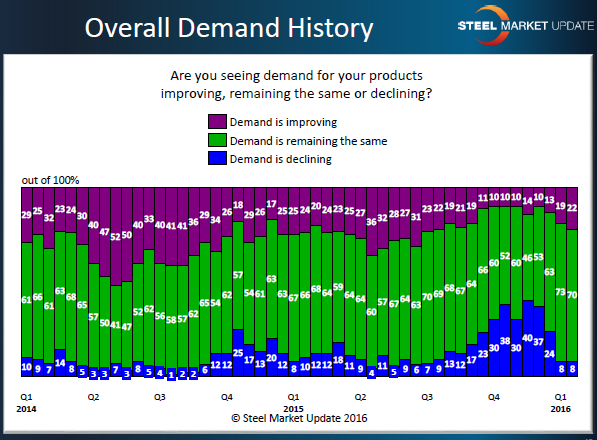
One of the keys we watch and include in our market analysis is to see what is the trend regarding demand. We report the results regarding demand to our Premium level subscribers in each presentation they receive during the month. Over the past couple of months we have begun to see a break in the trend as the percentage of respondents reporting demand as declining has dropped from 40 percent in mid-November to 8 percent this past week.
The graphic below depicts the results from all of the respondents participating in our market analysis this past week. Our Premium level members will have a more detailed look at the results as we have demand questions for our manufacturing and service center respondents separate from what we are showing below. Our Premium customers can view our Power Point presentation with those responses and much more online.