

Market Data

January 26, 2016
Currency Update for Steel Trading Nations
Written by Peter Wright
On December 16th the Federal Reserve raised the federal funds rate for the first time in almost a decade and as we write the FOMC is meeting once again and will make another announcement tomorrow regarding any change to the rate. None is expected though it is anticipated that four hikes could occur in 2016.
![]()
In the United States, the federal funds rate is “the interest rate” at which depository institutions (banks and credit unions) actively trade balances held at the Federal Reserve, called federal funds, with each other, usually overnight, on an uncollateralized basis.
Readers probably expected Treasury rates to jump after the December 16th move but they did not. Figure 1 shows the daily 10-year Treasury bond rate through January 25th.
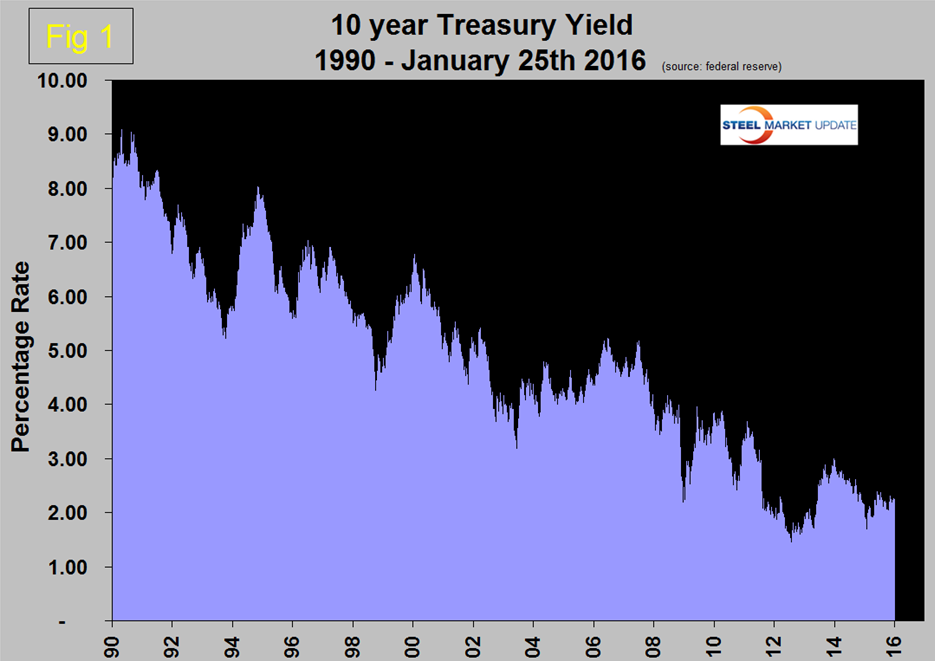
On December 16th the 10 year rate was 2.3 percent and on January 25th was 2.03 percent. The 3 month rate rose from 0.27 percent on December 16th to 0.31 percent on January 25th.
On January 24th Adam Whitehead wrote: The FOMC’s decision to start hiking interest rates remains a brave call given the global situation. The minutes of the last FOMC meeting showed just how close the call was. Janet Yellen was able to get unanimous commitment to hike, but this fell well short of a consensus on the strength of economy. For now the FOMC is relying on the mantra that (somehow) the US economy is “immune” from global headwinds blowing increasingly harder. As Fed speakers opine their views on the US economy, just how the lack of consensus is going to vitiate against the appearance of unanimity will become clearer. San Francisco Fed President John Williams believes that the global headwinds, especially from China, are the greatest risks that threaten a slowdown, “We are very connected to the rest of the world”. He was keen to remind observers that the Fed has the option to pause. The likelihood of such a pause on January 26/27th is high.
The latest data for the Broad Index value of the US $ against the currencies of our major trading partners was January 15th, which was ten days behind the individual steel trading currency data that we are presenting here. This is important because currencies are volatile in the current environment where the US is raising interest rates, Europe and Japan are intensifying quantitative easing and China is struggling with its new reality. On January 15th the daily BI at 125.6 was the highest it has been since late 2002 (Figure 2).
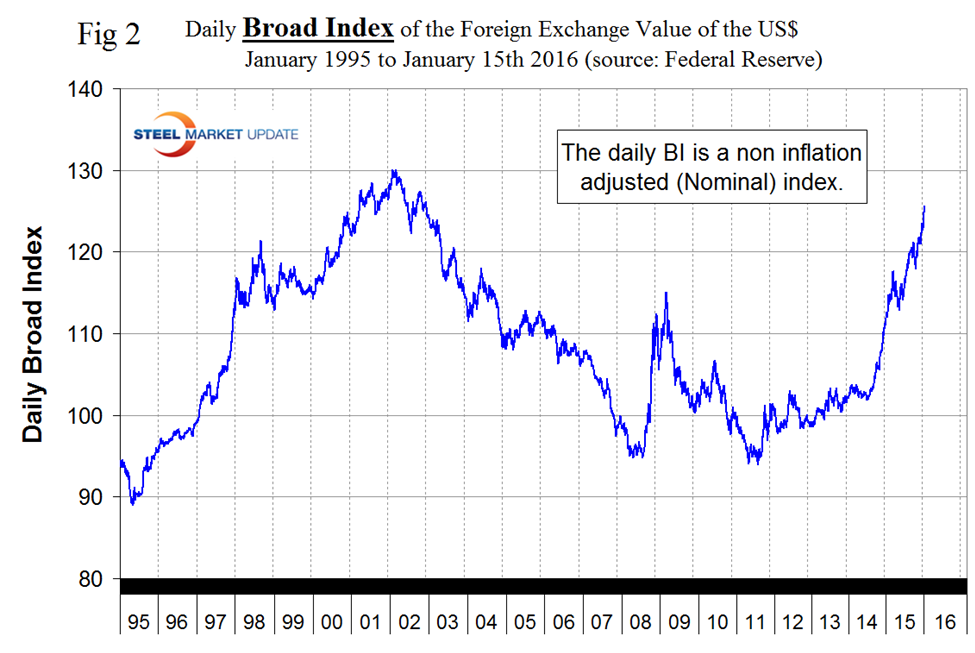
Table 1 shows the change in currencies of 16 steel and iron ore trading nations in one year, three months, one month and seven days for each currency and is color coded to indicate strengthening of the dollar in red and weakening in green.
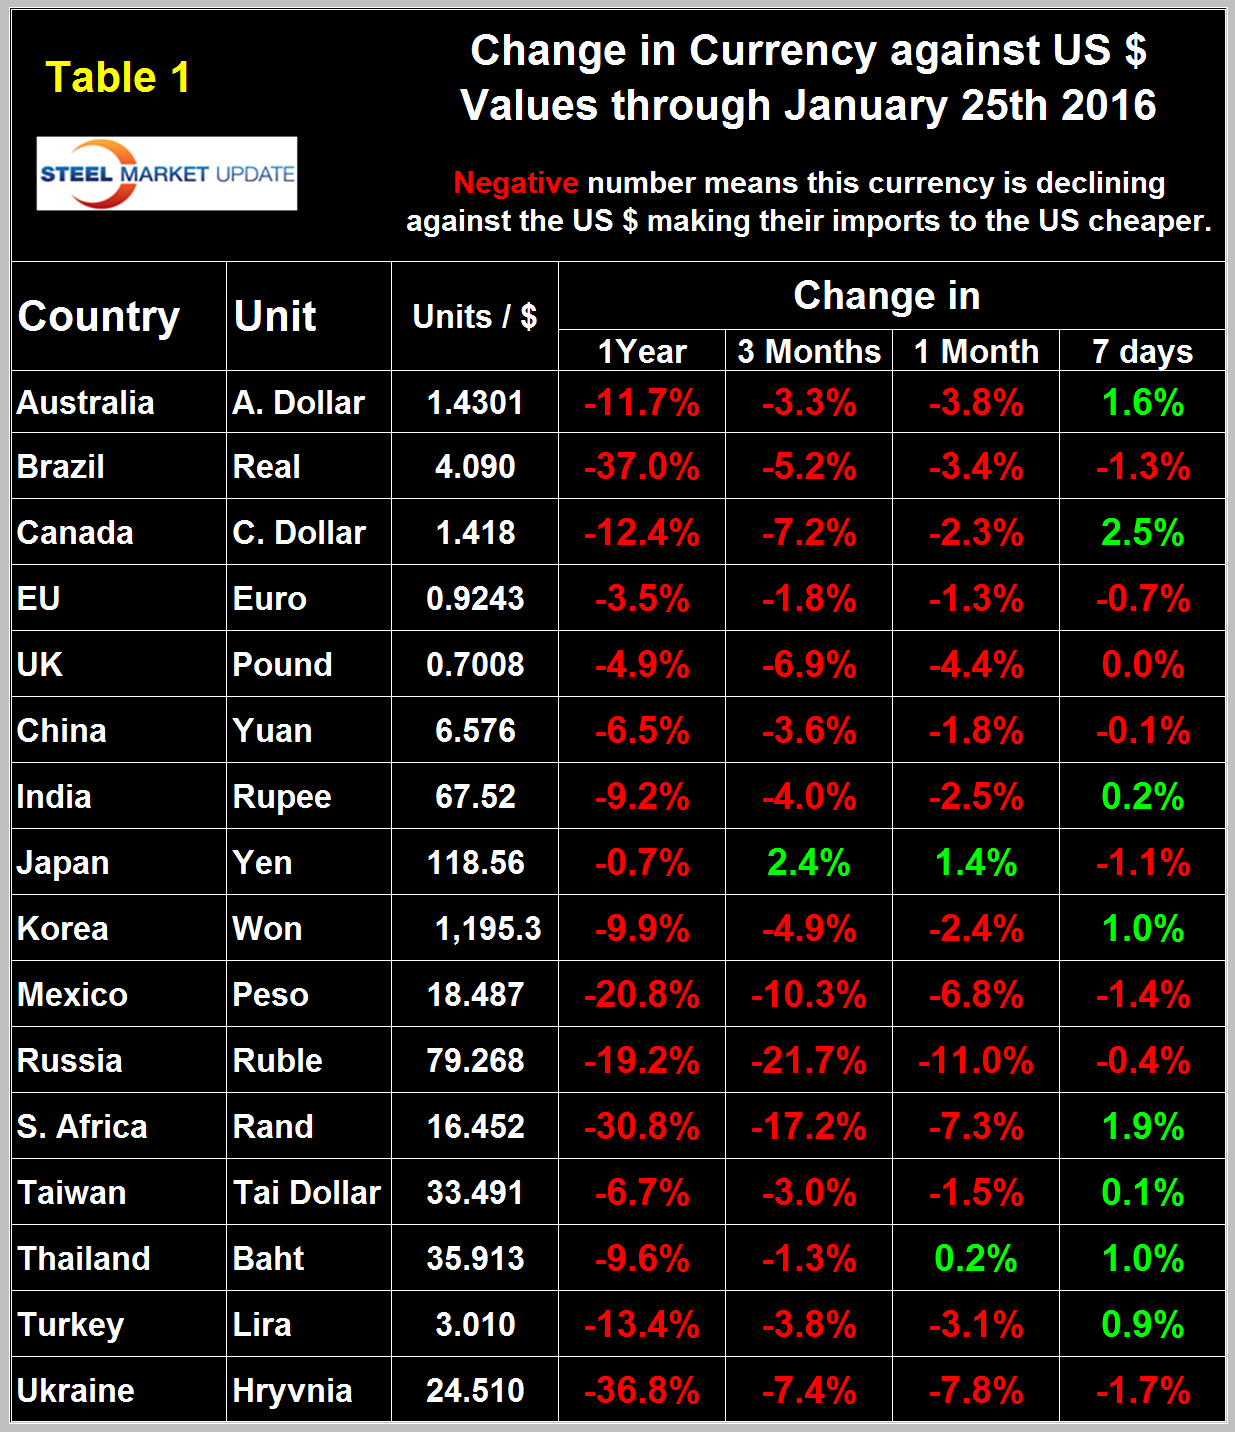
We regard strengthening of the US Dollar as negative and weakening as positive because the effect on net imports. In 2014, 25 percent of the U.S. economy was related to international trade therefore currency swings can have a huge effects on the economy in general and of the steel industry in particular. In the 7 days before December 17th the dollar strengthened against 13 of the 16 currencies under consideration as traders increased their dollar positions to obtain a better return on their assets. Then in the 8 days before our last report on December 25th the dollar did a complete reversal and weakened against 13 of the 16 steel and raw materials trading currencies. We assume that currency traders over bought the dollar and then decided to reduce their positions. Now one month forward we can see that the dollar has strengthened against eight of the steel trading nations and weakened against the other eight suggesting that tomorrow’s announcement is a bit of a non-event in the trader’s minds.
In each of these reports we comment on a few of the 16 steel trading currencies listed in Table 1 and include extracts from sources that we have come across and that we deem credible. Charts for each of the 16 currencies listed in Table 1 are available through January 25th for any reader who requests them.
The Euro
On January 25th it took 1.0819 US dollars to buy one Euro (Figure 3).
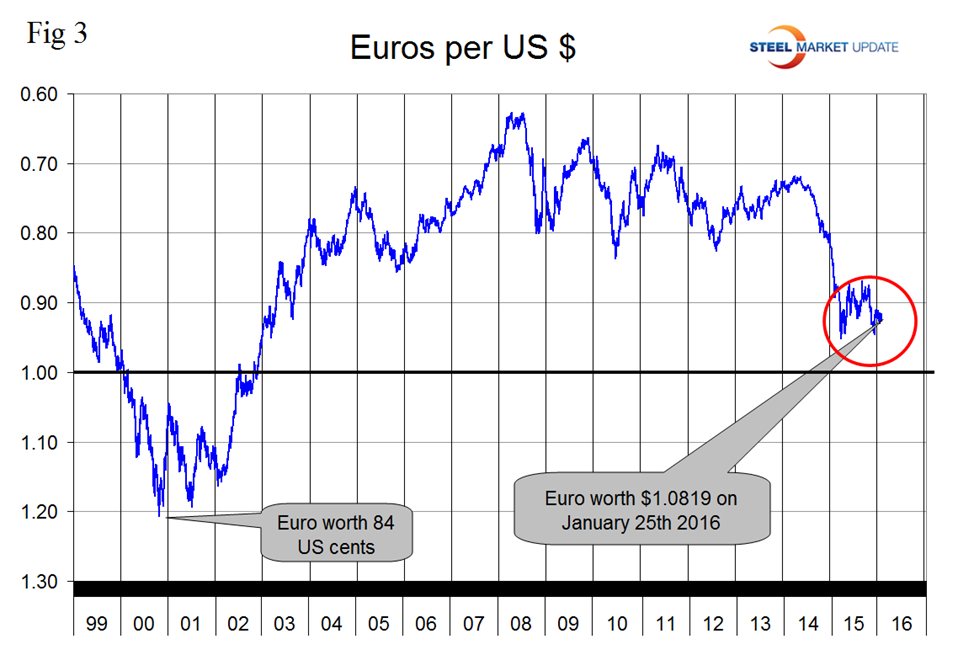
Through that date the Euro had weakened by 3.5 percent in one year and by 1.3 percent in the last month. The Euro had a recent low of 1.0580 on November 30th. The euro has been under pressure because of the monetary policy divergence between the Fed and the ECB. Mario Draghi, ECB President, famously said in 2012 that he would do “whatever it takes” and investors are now getting ready for another round of stimulus. On January 21st mark Chandler wrote, “ECB President Draghi has sent the euro back down into the lower end of the recent range as he gave a strong signal that additional action could be delivered as early as March, the next meeting. Draghi embraced and defended the ECB’s action but clearly and unequivocally opened the door wide for more action. By indicating that rates will remain at the current low level or lower is a signal that the negative 30 basis points deposit rate has not exhausted room for more cuts. He asserted that the ECB has the “power, determination and willingness” to act. This is important because some have argued that the mild action in December meant that the ECB no longer had the will or means to take bolder action. Draghi is trying to refute this impression. Moreover, Draghi argues that the downside risks have materialized in recent weeks. The worsening of the conditions requires a review and reassessment of the ECB’s stance. Review is straightforward. It is evaluating the impact of the actions that is tricky. It is clear that Draghi thinks more action is necessary.”
The Russian Ruble
On January 25th the Russian Ruble was down by 19.1 percent in one year and 11.0 percent in one month (Figure 4).
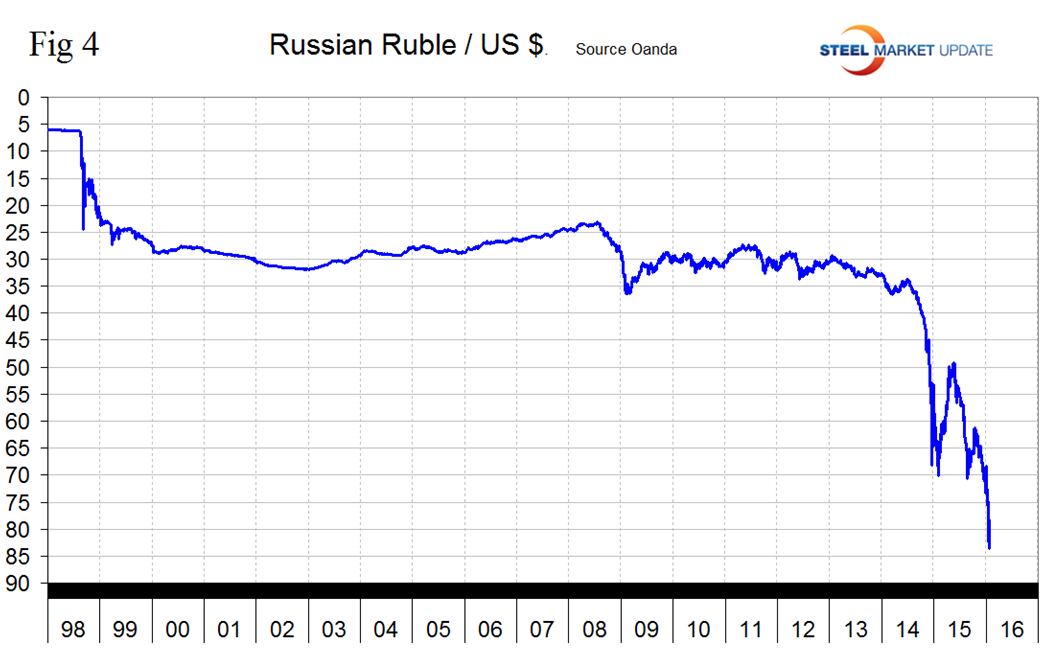
The Ruble bottomed out at 83.66 to the dollar on January 21st before recovering to 79.27 on the 25th. In Late December Das Kapital published the following; Business sentiment in Russia continues to decline. The presence of both falling energy prices and sanctions by Western powers are weighing on business activity. As the factors weighing on Russia continue in 2016, its economy should remain under pressure. In the most recent month, business sentiment measures continued to deteriorate. December saw a reading of -11, down from -9 the previous month. A reading below zero signals pessimism. Since the summer of 2014, oil prices have collapsed by nearly 70 percent. With Russia being as dependent as it is on energy prices, its export revenue, and thus overall economic activity tumbled. Furthermore, sanctions imposed by Western powers on Russia due to acts of aggression against Ukraine have affected business in Russia as well. Financing from Western institutions has been cut off to many companies operating in Russia, forcing such companies to repay loans quicker than expected. Reducing credit to Russian companies cut into economic activity. The confluence of both lower energy prices and western sanctions resulted in investment outflows by foreigners, weighing on its currency’s strength. As a result, Russia’s central bank increased its lending rate to deter outflows. This only magnified the losses in the ruble as economic activity declined, and inflation spiked higher.
The Canadian Dollar
The Canadian dollar broke through 70 US cents on January 14th reaching 68.48 cents on the 20th and rebounded to 70.53 on the 25th. Through the 25th the Canadian $ was down by 12.4 percent in one year and by 2.3 percent in the last month (Figure 5).
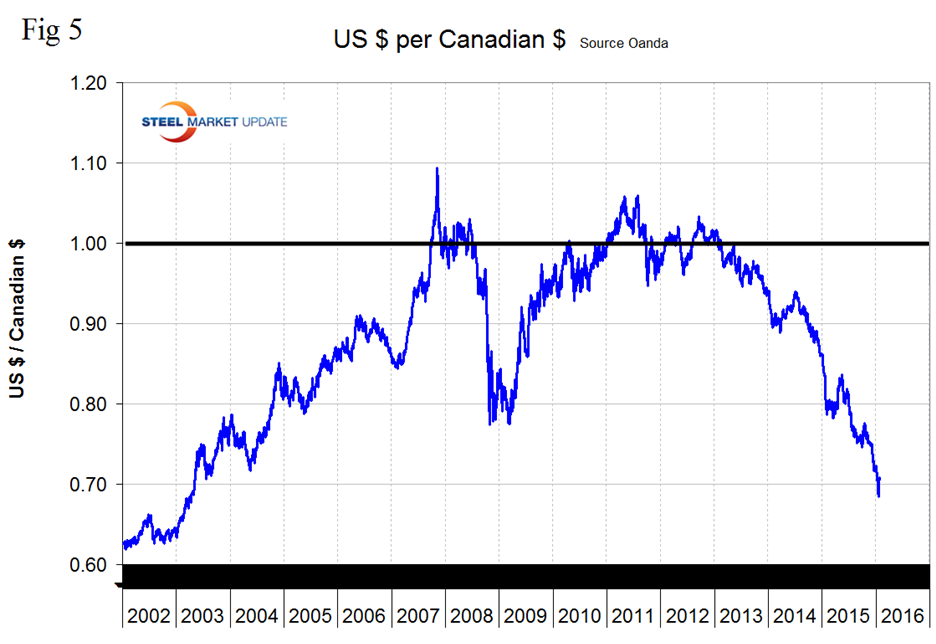
The days when the Canadian $ was worth more than the US $ are now a distant memory.
The Chinese Yuan
Following the devaluation in August the Yuan bottomed out at 6.4028 on August 27th. Then it recovered to 6.3185 on October 31st bottomed out again on January 9th at 6.5907 and has since recovered slightly to 6.5761 on the 25th (Figure 6).
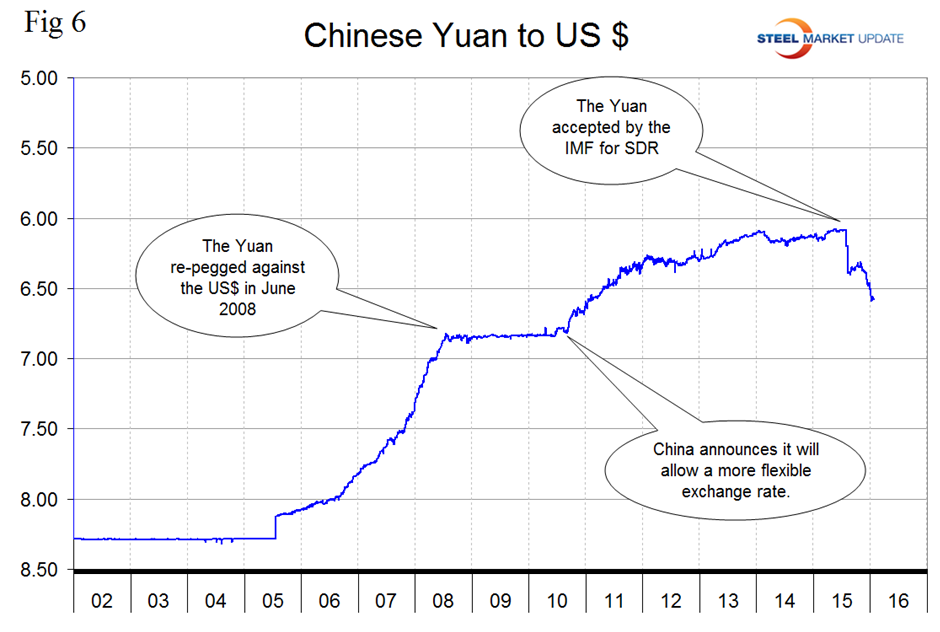
On November 30th the IMF released its decision on inclusion of the Yuan, also known as the Renminbi in the basket of currencies that underwrite the SDR (Special Drawing Rights). The currency fell ahead of the announcement as its lack of convertibility could affect the final weighting it has in the SDR.
On January 8th the Financial Lexicon published the following: There are those who think China is maliciously devaluing its currency because the government, of late, keeps setting the daily fix lower. In fact, what’s happening is China is simply adjusting the fix in an attempt to bring it more in line with where the yuan is trading in Hong Kong, where the currency floats more freely. Outflows from China are significant. People are selling the yuan. The Chinese government, instead of being a buyer of dollars and a seller of yuan, as it was in the past, is now a buyer of yuan and a seller of dollars, which adds deflationary pressures to the global economy. After all, as China’s forex reserves fall, down $512.7 billion in 2015, China has fewer reserves available for the purchase of all sorts of other global assets. By the way, the same thing is true of oil-producing nations. As lower oil prices cause the forex reserves of oil-producing nations to fall, there is less money available for sovereign wealth funds, etc. to be buyers of global assets. China’s deflating bubble economy is the impetus for its falling currency. That, in turn, means China’s slowing economy is putting upward pressure on the U.S. dollar. While the Fed’s expected future tightening of monetary-policy has been the bigger contributor to the stronger dollar, anything exerting upward pressure on the dollar (such as the weakening Chinese currency), is also a contributor to falling commodity prices (the dollar plays a role in that), falling global forex reserves (as a result of falling commodities), and global financial markets’ weakness.
On January 26th China’s fickle stock markets sold off sharply, amid concerns about capital outflows, a renewed selloff in oil, and caution ahead of the Fed’s monetary policy decision. News that the PBOC conducted its biggest daily open markets operation in three years failed to lift sentiment, as the central bank injected 360B yuan into money markets ahead of the country’s Lunar New Year holiday. Investors also remain wary about further weakness in the yuan, despite assurances from Beijing that it has no intention of pushing the currency lower.
Explanation of Data Sources: The broad index is published by the Federal Reserve on both a daily and monthly basis. It is a weighted average of the foreign exchange values of the U.S. dollar against the currencies of a large group of major U.S. trading partners. The index weights, which change over time, are derived from U.S. export shares and from U.S. and foreign import shares. The data are noon buying rates in New York for cable transfers payable in the listed currencies. At SMU we use the historical exchange rates published in the Oanda Forex trading platform to track the currency value of the US $ against that of sixteen steel trading nations. Oanda operates within the guidelines of six major regulatory authorities around the world and provides access to over 70 currency pairs. Approximately $4 trillion US $ are traded every day on foreign exchange markets.


